


| Title | Type | Number | Release Date |
|---|---|---|---|
|
5 Series MSO Upgrade Guide
Many of the features of the 5 Series MSO are field-upgradable, including bandwidth, record
length, arbitrary/function generator, logic channels, and protocol support. This fact
sheet lists all available post-purchase upgrades.
|
Fact Sheet | 55W-61103-15 | |
|
Application Software Bundles for the 4, 5 and 6 Series MSO Oscilloscopes
Learn about the application software bundles that are available for the 4, 5 and 6 Series
MSOs. Application bundles are a great alternative to purchasing individual software
options, especially if you plan to address diverse applications with your o …
|
Brochure | 48W-73761-5 | |
|
5 Series MSO
The 5 Series MSO datasheet provides an overview of the product's features, important
specifications, and ordering information.
|
Datasheet | 48W-60850-20 | |
|
4, 5, 6 Series Mixed Signal Oscilloscope Programmer Manual
This document describes the remote access programming commands for the MSO44, MSO46, MSO54,
MSO56, MSO58, MSO58LP, MSO64, MSO64B, MSO66B, MSO68B, and LPD64 instruments.
|
Programmer | 077130515 | |
|
4/5/6 Series MSO
The printable version of the 4/5/6 Series MSO on-instrument help system provides operation,
features, and function information. This document supports firmware version V1.36.x and
above.
|
Primary User | 077130316 | |
|
5 Series Mixed Signal Oscilloscope Service Manual
This manual provides theory of operation, service instructions, and a list of replaceable
parts for 5 Series MSO instruments.
|
Service | 077130705 | |
|
5 SERIES MSO (NON-WINDOWS) FIRMWARE - V1.36.2
SOFTWARE FOR MSO54, MSO56, MSO58, MSO58LP, V1.36.2
|
Firmware | 066196416 | |
|
5 SERIES MSO WINDOWS FIRMWARE - V1.36.2
SOFTWARE FOR MSO54, MSO56, MSO58, V1.36.2
|
Firmware | 066196516 | |
|
TekDrive Collaborative Data Workspace Flyer
TekDrive is a collaborative data workspace that provides an oscilloscope-to-cloud software
solution for instant data sharing and recall on an oscilloscope, PC, phone, or tablet.
This document highlights how TekDrive helps you stay productive while w …
|
Brochure | 61W-73789-1 | |
|
Tektronix TekExpress LVDS Automated test solution on the 5/6 Series MSO V1.1.1
The Tektronix TekExpress LVDS transmitter test application offers a physical layer test
solution for transmitter parameter measurements and characterization.
|
Application | 066170916 | |
|
Reference Waveform File Format
This document specifies the reference waveform file format for the instrument.
|
Programmer | 077022012 | |
|
5 and 6B Series Mixed Signal Oscilloscopes
This document helps customers with data security concerns to sanitize or remove memory
devices from their 6 Series B MSO instrument. The instructions also support 5 Series MSO
instruments with a serial number of B020000 and above or C040000 and above.
|
Declassification | 077169401 | |
|
5/6 Series MSO with Option 5-SEC or 6-SEC Enhanced Security
This document describes how to clear or sanitize 5 Series and 6 Series MSO instruments that
have option 5-SEC or 6-SEC installed, to allow removal from a secured area, or returning the
instrument for repair.
|
Declassification | 077140803 | |
|
Solutions for RADAR and Electronic Warfare
Tektronix offers a wide range of hardware and software built to help you design and test
mission-critical RF systems, such as military comms, radar and electronic warfare—from
algorithm prototyping to testing to ongoing maintenance. Our products are …
|
Brochure | 46A-61169-2 | |
|
TekExpress Automotive Ethernet Compliance Analysis Solution
This is a PDF version for the TekExpress Automotive Ethernet application help.
|
User | 077167903 | |
|
Wave Inspector® Navigation and Search: Simplifying Waveform Analysis
Discover how the Tektronix Wave Inspector® navigation and search capability gives you
the tools to extract the answers you need fast and efficiently.
|
Application Note | 48T-19039-9 | |
|
Yokogawa DLM4000 Series vs. 5 Series MSO Mixed Signal Oscilloscope Comparison
This fact sheet compares important specifications and features of the Tektronix 5 Series MSO
Mixed Signal Oscilloscope to those of the Yokogawa DLM4000 Series
|
Competitive | 65W-61251-0 | |
|
Keysight S-Series vs. 5 Series MSO Mixed Signal Oscilloscope Comparison
This fact sheet compares important specifications and features of the Tektronix 5 Series MSO
Mixed Signal Oscilloscope to those of the Keysight S-Series
|
Competitive | 65W-61108-0 | |
|
Ensuring the Performance and Conformance of In-Vehicle Networks for New-Generation
Automobiles
This primer provides an overview of the trends, challenges and solutions associated with the
expected future evolution of in-vehicle networks, as well as a foundation for testing
in-vehicle networks to accelerate new designs to production, streamline …
|
Primer | 48W-61611-0 | |
|
Electronics Engineering For Cleaner Skies
How Tektronix products have helped the RAISE project take off
|
Case Study | ||
|
Visual Triggers: Graphical Methods for Capturing Bursts and Other Complex Signals on
Oscilloscopes
Visual triggers let you capture waveforms of interest by drawing trigger areas on an
oscilloscope display. Start by learning how to trigger on bursts of specific length,
then move on to pulse trains and more complex signals.
|
Technical Brief | 48W-61452-0 | |
|
How to Minimize Probe Loading with Low Capacitance Probes
This application note describes how the high bandwidth, low capacitance passive voltage
Tektronix probes bridge the gap between general purpose passive probes and higher cost
active probes.
|
Application Note | 51W-26294-6 | |
|
Debugging SENT Automotive Buses with an Oscilloscope
SENT bus is used in automotive sensors to transmit measurements to electronic control units.
This application note gives a brief orientation on SENT and explains how to set up decoding
and triggering on a 5 Series MSO oscilloscope equipped with SENT …
|
Application Note | 55W-61326-1 | |
|
5 Series MSO - What's in the Box
This factsheet shows the probes and accessories that are included with a 5 Series MSO
oscilloscope.
|
Fact Sheet | 48W-61667-0 | |
|
Identifying Setup and Hold Violations with a Mixed Signal Oscilloscope
Mixed signal oscilloscopes (MSOs) are able to capture both analog and digital
representations of signals, making them well-suited for identifying problems with setup and
hold times. Learn how to use the digital capture functions of an MSO, as well a …
|
Application Note | 55W-61095-0 | |
|
Oscilloscope Selection Guide
From basic signal-checking to high-performance analysis, this selection guide gives an
overview of the complete range of oscilloscopes from Tektronix.
|
Selection Guide | 46W-31080-8 | |
|
Understanding and Characterizing Timing Jitter Primer
Timing jitter is the unwelcome companion of all electrical systems that use voltage
transitions to represent timing information. This paper focuses primarily on jitter in
electrical systems.
|
Primer | 55T-16146-5 | |
|
Innovation that drives innovation
|
Case Study | ||
|
RTO2000 Series Rohde & Schwarz Oscilloscope vs. 5 Series MSO
This fact sheet compares important specifications and features of the Tektronix 5 Series MSO
Mixed Signal Oscilloscope to those of the Rohde & Schwarz RTO2000 Series
|
Competitive | 65W-61112-0 | |
|
Keysight X6000 Series vs. 5 Series MSO Mixed Signal Oscilloscope Comparison
This fact sheet compares important specifications and features of the Tektronix 5 Series MSO
Mixed Signal Oscilloscope to those of the Keysight X6000 Series
|
Competitive | 65W-61109-0 | |
|
Tools to Boost Oscilloscope Measurement Resolution to More than 11 Bits
Measurement resolution depends on more than the number of bits coming out of an
oscilloscope's ADC. You need to have a whole-system, end-to-end approach to limit the
effects of noise, as well as improve resolution. Learn measurement and signal-proces …
|
Application Note | 48W-27802-4 | |
|
Troubleshooting Ethernet Problems with your Oscilloscope
Learn the basics of the 10BASE-T and 100BASE-TX Ethernet physical layers to help you
troubleshoot bus problems or related system issues. Learn how to set up and interpret the
results when using automated decoding, triggering, and search on an oscillo …
|
Application Note | 55W-61093-1 | |
|
Debugging CAN, LIN and FlexRay Automotive Buses with an Oscilloscope
Explains the physical layer basics of CAN, LIN, and FlexRay serial buses to troubleshoot bus
problems or system issues. Learn how to use automated decoding, triggering, and search on an
oscilloscope equipped with automotive bus analysis capability.
|
Application Note | 55W-61098-3 | |
|
Debugging SPMI Power Management Buses with an Oscilloscope
Get a brief orientation on the physical layer and packet structures of SPMI power management
bus and learn how to set up decoding, triggering, and searching on an oscilloscope equipped
with SPMI decoding.
|
Application Note | 48W-61436-0 | |
|
Debugging Serial Buses in Embedded System Designs
Learn the basics of the hardware protocols of the most common serial buses. Find out how to
use the protocol trigger, decode and search capabilities of oscilloscopes to solve serial
bus integration and debug challenges.
|
Application Note | 48W-19040-21 | |
|
How to Use a Mixed Signal Oscilloscope to Test Digital Circuits
Learn more about verifying and debugging complex designs with a Mixed Signal Oscilloscope
(MSO).
|
Application Note | 3GT-24008-4 | |
|
Troubleshooting Multiple-bus Systems Using FlexChannel Input Channels Tech Brief
Troubleshooting embedded systems often demands more than the 2 or 4 measurement channels
available on most oscilloscopes. Using a mixed signal oscilloscope and clever
application of digital channels can provide much broader system visibility. This …
|
Technical Brief | 55W-61100-2 | |
|
Power Supply Converter Design Procedures
This poster offers insight into power supply converter design procedures.
|
Poster | 48W-61607-0 | |
|
LeCroy HDO9000 Series vs. 5 Series MSO Mixed Signal Oscilloscope Comparison
This fact sheet compares important specifications and features of the Tektronix 5 Series MSO
Mixed Signal Oscilloscope to those of the LeCroy HDO9000 Series
|
Competitive | 65W-61110-0 | |
|
LeCroy HDO6000A/HDO8000A Series vs. 5 Series MSO Mixed Signal Oscilloscope Comparison
This fact sheet compares important specifications and features of the Tektronix 5 Series MSO
Mixed Signal Oscilloscope to those of the LeCroy HDO6000A Series and HDO8000A Series
|
Competitive | 65W-61111-0 | |
|
Automotive Ethernet: See the True Signal
As the move toward Automotive Ethernet technology in vehicles accelerates, comprehensive
design validation is vital to ensure interoperability and reliable operation across multiple
ECUs. This application note provides information on Automotive Ether …
|
Application Note | 48W-61604-0 | |
|
Making Accurate Current Measurements on Power Supplies with Oscilloscopes
Learn how to measure current using shunt resistors and voltage probes, and how to use
clamp-on current probes with your oscilloscope. Get tips on improving the resolution of your
current measurements and avoiding common pitfalls.
|
Application Note | 51W-60171-2 | |
|
Troubleshooting USB 2.0 Problems with Your Oscilloscope
Learn the basics of the USB 2.0 physical layer to troubleshoot bus problems or system
issues. Learn how to set up and interpret the results when using automated decoding,
triggering, and search on an oscilloscope equipped with USB 2.0 bus analysis c …
|
Application Note | 55W-61092-1 | |
|
XYZs of Oscilloscopes Primer
After reading this primer, you will be able to: Describe how oscilloscopes work, Describe
the differences between analog, digital storage, digital phosphor, and digital sampling
oscilloscopes, describe electrical waveform types, understand basic osci …
|
Primer | 03Z-8605-7 | |
|
Using FastFrame Segmented Memory on the 4/5/6 Series MSO
Learn how to use FastFrame segmented memory on the 4, 5, and 6 Series MSOs to capture
more critical signal information by capturing important bursts and ignoring deadtime
|
Technical Brief | 55W-61299-2 | |
|
Probing Techniques for Accurate Voltage Measurements on Power Supplies with Oscilloscopes
This application note explains probing techniques for making high-quality measurements on
power supplies. It covers the use of passive and differential probes with emphasis on
applications in power conversion circuits.
|
Application Note | 51W-60161-3 | |
|
Troubleshooting Analog to Digital Converter Offset Using a Mixed Signal Oscilloscope
Shows how to perform quick checks on an Analog to Digital Converter (ADC) gain, offset and
linearity, using a function generator and mixed signal oscilloscope (MSO). The MSO is
used to uncover a problem with offset error.
|
Application Note | 55W-61096-0 | |
|
Tek049 ASIC Powers Next-Generation Oscilloscopes
The Tek049 ASIC is the powerhouse behind Tek’s new 5 Series MSO, and it will power
next-generation oscilloscopes. This paper examines some of the technology and innovations in
this new mixed-signal ASIC.
|
Whitepaper | 55W-61320-0 | |
|
Measuring Digital Clock Stability and Jitter with an Oscilloscope
Learn techniques for quantifying clock stability and jitter over billions of cycles using
statistics and jitter analysis tools.
|
Application Note | 48W-61379-1 | |
|
How to Troubleshoot System Problems Using an Oscilloscope with I2C and SPI Decoding
Learn about the physical layers of the most common interchip buses - I2C and SPI - to enable
you to troubleshoot bus problems or system issues. Learn how to set up and interpret
the results when you use automated decoding, triggering, and search on …
|
Application Note | 55W-61091-1 | |
|
Control Loop Analysis Kit for Power Design Stability Measurements
This document describes how the Tektronix Control Loop Analysis Kit provides a simple test
setup for validating and debugging feedback loop stability. This setup
also enables engineers to test power supply rejection ratio (PSRR) on the regulator sta
…
|
Application Overview | 55W-61596-0 | |
|
TekExpress Automotive Ethernet (10BASE-T1S/100BASE-T1/1000BASE-T1/MultiGBASE-T1) Automated
Compliance Solution - MSO5 and MSO6/B series - V1.5.2
The Tektronix TekExpress Automotive Ethernet solution provides automated compliance test
support for 10Base-T1S (IEEE P802.3cg), 100BASE-T1 (IEEE Std.802.3bw™) , 1000BASE-T1
(IEEE Std 802.3bp™-2016) and Multigigabit Ethernet MultiGBASE-T1(IEEE Std 80 …
|
Application | 066208906 | |
|
4/5/6 Series MSO Option License
This document describes how to install optional upgrade licenses to add new functions or
features to 4, 5 and 6 Series MSO instruments.
|
Field Install Instructions | 071351904 | |
|
5/6 Series MSO Option SUP5-WIN, SUP5-LNX, SUP6-WIN, SUP6B-WIN, SUP6B-LNX
This document describes how to install SSD options on 5 and 6 Series MSO instruments.
|
Field Install Instructions | 071352403 | |
|
Next-Generation Oscilloscopes Brochure - 3 Series MDO, 4 Series MSO, 5 Series MSO, 6 Series
MSO
The 3 Series MDO and 4, 5 and 6 Series MSOs offer the largest displays and the
greatest user experience of any oscilloscope. This brochure gives an overview of the
platforms, with the similarities and differences between the four series.
|
Brochure | 48W-61573-3 | |
|
Measuring the Control Loop Response of a Power Supply Using an Oscilloscope
Learn how modern oscilloscopes can be used to build Bode plots for frequency response
analysis, determine gain and phase margins, and evaluate power supply designs for
stability.
|
Application Note | 48W-73793-1 | |
|
5 SERIES MSO (NON-WINDOWS) FIRMWARE - V1.34.8
SOFTWARE FOR MSO54, MSO56, MSO58, MSO58LP, V1.34.8
|
Firmware | 066196415 | |
|
5 SERIES MSO WINDOWS FIRMWARE - V1.34.8
SOFTWARE FOR MSO54, MSO56, MSO58, V1.34.8
|
Firmware | 066196515 | |
|
SignalVu-PC
Provides in-depth information on how to use the SignalVu-PC Vector Signal Analysis Software.
This PDF version of the Help contains the most complete descriptions of how to use the base
software and all of its optional applications.
|
Online Help | 077072016 | |
|
4/5/6 Series MSO
This is a version of the 4/5/6 Series MSO (MSO44. MSO46, MSO54, MSO56, MSO58, MSO58LP,
MSO64, LPD64, MSO64B, MSO66B, MSO68B) on-instrument help system. Supports firmware version
V1.32.x.
|
Primary User | 077130315 | |
|
Magway Zero Emissions IMDA Case Study
Magway, an innovative start-up in London, is developing a new rail-based parcel delivery
system with the help of advanced DQ axis analysis from Tektronix with the 5 Series
MSO Mixed Signal Oscilloscope and current (TCP0030A) and differential voltage …
|
Case Study | 48W-73817-0 | |
|
How do I recover my Windows system image on a 5 or 6 Series MSO?
The procedure for recovering a Windows system image on a 5 or 6 Series MSO is outlined in
the section labeled “Restoring a Windows SSD” in the “Option SUP5-WIN, SUP6-WIN, SUP6B-WIN,
SUP6B-LNX Upgrade Kit Installation Instructions”. This document can …
|
Faq | 783012 | |
|
5 Series MSO
This document contains the specifications and performance verification procedures for the 5
Series MSO, for firmware version 1.4 and above.
|
Performance Verification | 077130606 | |
|
Effective Measurement of Signals in Silicon Carbide (SiC) Power Electronics Systems
How to make accurate gate voltage, drain voltage, and current measurements on silicon
carbide (SiC) power devices with oscilloscopes.
|
Application Note | 48W-73812-0 | |
|
5 Series MSO
This manual provides theory of operation, service instructions and a list of replaceable
parts for the 5 Series MSO instruments.
|
Service | 077130703 | |
|
Software for the Education Lab
Tektronix offers a range of efficient and intuitive remote education solutions that combine
with our oscilloscopes, DMMs, data acquisition systems, or other tools to help students put
engineering theory into practice. Read this flyer to learn how ou …
|
Fact Sheet | 48W-73784-0 | |
|
TekExpress Ethernet Compliance Solution
This document contains operation information for the TekExpress Ethernet Tx Compliance
Solution. It is a PDF version of the help system accessible in the TekExpress software.
|
Primary User | 077150405 | |
|
Comparing the Traditional Oscilloscope FFT to Spectrum View Spectrum Analysis for Measuring
Power Supply Control Loop Frequency Response
Bode plots using built-in digital downconverters (Spectrum View) can provide better
resolution than traditional FFTs. Demonstrated on two different devices under test.
|
Whitepaper | 48W-73778-0 | |
|
5-CMUSB2, 6-CMUSB2 - 5 Series MSO, 6 Series MSO - V1.2.5
The Tektronix USB2.0 compliance test application (Opt. 5-CMUSB2, Opt. 6-CMUSB2) running on a
5 Series MSO and 6 Series MSO oscilloscope provides a one-button compliance testing for
USB2.0 devices, hosts, and hubs. The USB software automates the compl …
|
Application | 066166809 | |
|
Programming Interface Translator Technical Brief
Explains the Programming Interface Command Translator which enables state-of-the-art
oscilloscopes to interpret commands for older oscilloscopes, facilitating the replacement of
older oscilloscopes in automated systems without changing commands.
|
Technical Brief | 48W-73775-0 | |
|
TekExpress Automotive Ethernet (10BASE-T1S/100BASE-T1/1000BASE-T1) Automated Compliance
Solution - MSO5 and MSO6/B series - V1.4.2
Tektronix TekExpress Automotive Ethernet solution provides automated compliance test support
for 100Base-T1 (IEEE Std.802.3bw), 1000Base-T1 (IEEE Std 802.3bp™-2016) standard and Open
Alliance TC8 ECU specification for PMA Transmitter electrical speci …
|
Application | 066208905 | |
|
5 SERIES MSO (NON-WINDOWS) FIRMWARE - V1.32.1
SOFTWARE FOR MSO54, MSO56, MSO58, MSO58LP, V1.32.1
|
Firmware | 066196414 | |
|
5 SERIES MSO WINDOWS FIRMWARE - V1.32.1
SOFTWARE FOR MSO54, MSO56, MSO58, V1.32.1
|
Firmware | 066196514 | |
|
4/5/6 Series MSO
This is a printable version of the 4/5/6 Series MSO (MSO44. MSO46, MSO54, MSO56, MSO58,
MSO58LP, MSO64, LPD64) on-instrument help system. Supports firmware version V1.32.x.
|
Primary User | 077130314 | |
|
Replicating Real World Signals with an Arbitrary/Function Generator
Learn how to simulate sensor and bus signals on an arbitrary waveform generator. Find
out how to capture signals using an oscilloscope, edit them using PC software, and play them
back on an arbitrary/function generator.
|
Application Note | 76W-18661-2 | |
|
4, 5, 6 Series MSO
This document describes the remote access programming commands for the MSO44, MSO46, MSO54,
MSO56, MSO58, MSO58LP, MSO64, MSO64B, MSO66B, MSO68B, and LPD64 instruments.
|
Programmer | 077130513 | |
|
TekExpress Industrial Ethernet (10BASE-T1L) Automated Compliance Solution - MSO5 and MSO6/B
series - V1.0.1
TekExpress Industrial Ethernet Compliance SolutionThe TekExpress Industrial Ethernet
application (10Base-T1L) is a compliance test solution for performing transmitter electrical
specification measurements and MDI return loss measurements in accordanc …
|
Application | 066203601 | |
|
TekExpress Automotive Ethernet (10BASE-T1S/100BASE-T1/1000BASE-T1) Automated Compliance
Solution - MSO5 and MSO6/B series - V1.4.1
Tektronix TekExpress Automotive Ethernet solution provides automated compliance test support
for 100Base-T1 (IEEE Std.802.3bw), 1000Base-T1 (IEEE Std 802.3bp™-2016) standard and Open
Alliance TC8 ECU specification for PMA Transmitter electrical speci …
|
Application | 066208902 | |
|
Tektronix TekExpress LVDS Automated test solution on the 5/6 Series MSO V1.01
The Tektronix TekExpress LVDS transmitter test application offers a physical layer test
solution for transmitter parameter measurements and characterization.
|
Application | 066170913 | |
|
Characterizing Self-Generated EMI for Wireless and IoT Products with 4, 5 or 6 Series MSO
Oscilloscopes
Learn how to use near-field probes and spectrum analysis on 4, 5 and 6 Series MSOs to look
for potential sources of self-interference, especially on the compact wireless IoT devices.
|
Application Note | 48W-67729-1 | |
|
Verifying ESD Simulator Performance Using an Oscilloscope
This application note will help designers verify the shape of current pulses from
electrostatic discharge (ESD) simulators prior to compliance or pre-compliance
testing.
|
Application Note | 48W-73760-0 | |
|
5 SERIES MSO (NON-WINDOWS) FIRMWARE - V1.30.5
SOFTWARE FOR MSO54, MSO56, MSO58, MSO58LP
|
Firmware | 066196413 | |
|
5 SERIES MSO WINDOWS FIRMWARE - V1.30.5
SOFTWARE FOR MSO54, MSO56, MSO58
|
Firmware | 066196513 | |
|
TekExpress Ethernet (1000BASE-T/ 1000Base-T Multipair, 100BASE-TX and 10BASE-T) Compliance
Solution - 5, 6 and 6B Series MSO - V1.2.3
With TekExpress Ethernet Compliance Test Software, engineers validating an Ethernet physical
layer can perform reliable compliance tests of 10Base-T, 100Base-TX, 1000Base-T and
1000Base-T Multipair technologies in their labs. This application enhanc …
|
Application | 066196758 | |
|
Tektronix Probe Selection Guide
Tektronix probes ensure the highest signal fidelity possible from your device-under-test to
your oscilloscope. With over 100 probe choices available, all perfectly matched to our
industry-leading oscilloscopes, you can find the probe you need for you …
|
Product Selector Guide | 61W_14232_11 | |
|
4, 5, 6 Series MSO
This document describes the remote access programming commands for the MSO44, MSO46, MSO54,
MSO56, MSO58, MSO58LP, MSO64, MSO64B, MSO66B, MSO68B, and LPD64 instruments. Supports
firmware version 1.26 and above.
|
Programmer | 077130512 | |
|
Troubleshooting ESD Failures Using an Oscilloscope
Learn techniques for troubleshooting electrostatic discharge (ESD) failures using an H-field
probe, oscilloscope and ESD simulator.
|
Application Note | 48W-73759-0 | |
|
Advanced Radar Analysis: Tools for Measuring Modern Radar Application Note
With today’s rapid advances in radar technology, developing and manufacturing highly
specialized and innovative electronic products to detect radar signals takes leading-edge
technology and tools. Tektronix innovative test equipment reduces testingun …
|
Application Note | 37W-23378-3 | |
|
Columbia University Case Study
Read this case study to learn how the Motor Drives and Power Electronics Lab (MPlab) at
Columbia University’s Electrical Engineering used an MSO58 8-channel oscilloscope to analyze
three-phase motor drives and multi-phase power electronics systems to …
|
Case Study | 48W-73754-0 | |
|
5 SERIES MSO (NON-WINDOWS) FIRMWARE - V1.30.2
Software (non-Windows) for MSO54, MSO56, MSO58, MSO58LP
|
Firmware | 066196412 | |
|
5 SERIES MSO WINDOWS FIRMWARE - V1.30.2
Windows Software for MSO54, MSO56, MSO58
|
Firmware | 066196512 | |
|
I downloaded and Installed OpenChoice Desktop, but it doesn't recognize my scope.
Refer to the Prerequisites.txt file available to download on the same page for
OpenChoice desktop. Make sure you have all the prerequisites specified.
Prerequisites
1. PC equipped with Microsoft Windows 7 32 Bit and 64 Bit OS, Windows 8.1 32 Bit …
|
Faq | 474266 | |
|
4, 5, 6 and 6B Series MSO, 5 and 6 Series Low Profile Digitizers IVI-COM Driver - V1.7.0
TekSeriesScope IVI-COM Driver for 4, 5, 6 and 6B Series Mixed Signal Oscilloscopes; 5 and 6
Series Low Profile Digitizers IVI Scope class-compliant driver. It complies with Scope Class
specifications (IVI-4.1) as defined by the IVI foundation. An IVI …
|
Driver | 066192808 | |
|
University of Naples Case Study
Students at The University of Naples are now able to focus more attention on the experiment
at hand, rather than worrying about the tool being used to monitor it. Read this case
study to learn how.
|
Case Study | 48W-61702-0 | |
|
5 Series MSO
This manual provides theory of operation, service instructions and a list of replaceable
parts for the 5 Series MSO instruments.
|
Service | 077130702 | |
|
Verifying Power Supply Sequencing with an 8-Channel Oscilloscope
You’ll learn the basics of checking the power-on and power-off sequence of an AC-DC power
supply, how to look at a bulk supply and various point of load regulators, and how an
oscilloscope with more than 4 channels can expedite the process.
|
Application Note | 55W-61152-1 | |
|
Using Mixed Signal Oscilloscopes to Find and Diagnose Jitter Caused by Power Integrity
Problems
Learn about the connection between signal integrity on data and clock lines, and power
integrity. Includes a review of jitter measurements and types of power rail noise that
cause jitter.
|
Application Note | 48W-61721-0 | |
|
Step by Step EMI Troubleshooting with 4, 5 and 6 Series MSO Oscilloscopes
A detailed process for EMI troubleshooting and debugging using Spectrum View synchronized
spectrum analysis on the 4, 5 and 6 Series MSOs.
|
Application Note | 48W-67730-0 | |
|
Achieve Higher Vertical Resolution for More Precise Measurements
This white paper describes an approach in which new oscilloscope ADC technology, combined
with digital signal processing and a low-noise front end, can provide even higher resolution
than found in conventional high bit-rate ADC implementations. It di …
|
Whitepaper | 48W-61648-1 | |
|
SignalVu-PC Vector Signal Analysis Software - V4.1.0022
SignalVu-PC VSA software brings the analysis engine of the Tektronix Real-Time Signal
Analyzer (RTSA) to your computer, enabling you to analyze live signals from RSA306, RSA500,
RSA600, RSA7100A\B Spectrum Analyzers, MSO54, MSO56, MSO58, MSO64, MDO40 …
|
Application | 066143424 | |
|
Chalmers University Case Study
Chalmers Formula Student is a team of 33 engineering students in Sweden who were designing
and building an electric, all-wheel drive race car to compete against other engineering
students. Chalmers Formula Student partnered with Tektronix who provid …
|
Case Study | 46W-61703-0 | |
|
SignalVu-PC
This document describes how to install SignalVu-PC, how to activate SignalVu-PC, how to
connect to an instrument with SignalVu-PC, and provides a brief introduction to the
application. SignalVu-PC can be used with the RSA306B, RSA500 Series, RSA600 Series, RSA7100
Series, MDO4000B/C, and MSO5/6 Series.
|
User | 077102417 | |
|
TekExpress Automotive Ethernet (10BASE-T1S/100BASE-T1/1000BASE-T1) Automated Compliance
Solution - MSO5 and MSO6 series - V1.4.0
Tektronix TekExpress Automotive Ethernet solution provides automated compliance test support
for 100Base-T1 (IEEE Std.802.3bw), 1000Base-T1 (IEEE Std 802.3bp™-2016) standard and Open
Alliance TC8 ECU specification for PMA Transmitter electrical speci …
|
Application | 066208901 | |
|
Jitter Testing for 1000BASE-T Ethernet Compliance Application Note
Describes Ethernet jittter testing including test fixtures, test modes, and types of tests
to ensure compliance with 10/100/1000BASE-T standards.
|
Application Note | 48W-61719-0 | |
|
My scope has Windows 10 version 1607, but more recent versions have been released by
Microsoft. Can my scope be updated?
No, but there is no need to. The Windows build on Tektronix scopes is from the
Long-Term Servicing Channel (Windows 10 Enterprise LTSC).
Unlike normal releases of version 1607, this release still receives security updates and
support from Microsoft, …
|
Faq | 780986 | |
|
Where can I locate the visual trigger setup on the 5 or 6 series MSO?
The visual trigger option is not listed in the trigger type selection
initially. To setup the visual trigger, simply click on the "DRAW A
BOX" icon (located in the lower right corner of the display) to draw the areas for
the visual trigger. After t …
|
Faq | 723951 | |
|
Where can I locate the save on trigger feature on the 5 series MSO?
It is in the “Acquisition” badge located in the lower right corner of the screen. It allows
the user to set the configuration to save the waveform file or screen capture when there is
a triggered event.
|
Faq | 474041 | |
|
Where can I find the positive/negative pulse count auto measurement on the 5/6 Series
MSO?
Currently, there is no auto measurement for the positive or negative pulse count on the 5/6
Series MSO.
The workaround would be using the “Search” feature to search for the pulse width.
First, set up for the positive pulse width auto measurement fo …
|
Faq | 773396 | |
|
What rackmount does my scope use?
Oscilloscope Family
Rackmount
3 Series MDO
RM3
4 Series MSO
RM4
5 Series MSO
R …
|
Faq | 64571 | |
|
What is the range of the logic threshold supported on the 5 and 6 Series MSO?
The logic threshold can be set between +/-40V with the TLP058 logic probe. Each
individual digital channel can be set for its own threshold level.
|
Faq | 468126 | |
|
What probe interface does my oscilloscope have?
Oscilloscope series
Probe interface
CSA7000/CSA7000B
TekConnect
DPO2000
TekVPI
DPO3000
…
|
Faq | 64251 | |
|
What is the difference between Windows 10 on my scope and standard Windows 10?
The Windows build on Tektronix scopes is from the Long-Term Servicing Channel (LTSC),
specifically Windows 10 Enterprise 2016 LTSB (Long-Term Service Branch 1607). You can
read more about the LTSC here: https://docs.microsoft.com/en-us/windows/whats …
|
Faq | 782291 | |
|
What is the deskew range and resolution between channels for the 5 or 6 series MSO?
Both 5 and 6 series MSO support a deskew range of -125ns to +125ns.
The 6 series MSO can be adjusted in 1ps resolution for all acquisition modes except Peak
Detect and Envelope (40ps resolution).
The 5 series MSO can be adjusted in 40ps resolution fo …
|
Faq | 723961 | |
|
What are some of the advantages of the 5 and 6 Series MSO digital trigger?
Since its invention by Tektronix in the 1940s, the oscilloscope’s trigger system has been a
key component of the products, providing a stable display of repetitive signals and the
capture of specific events in a signal. At the circuit level, the trig …
|
Faq | 467411 | |
|
I received the following message about my floating license:
(This is a courtesy note to remind you that the checkout of 1 floating license(s) will soon
expire.)
Why am I receiving this message when I own the license?
The Floating Licenses are good forever; however, the checkout of the Floating License
is good for for any duration from 4 hours up to 4 years, selectable at the time of
check out. After it reaches selected duration, it will automatically check itsel
…
|
Faq | 467516 | |
|
My Tektronix oscilloscope uses the Linux operating system. Where do I get a copy of
the linux open source code as stated in the GNU Lesser General Public License notice?
For our Linux based instruments or programs licensed under the “GNU General Public License
(GPL) or Lesser GNU General Public License (LGPL)” the complete corresponding sources are
available. You can order a complete machine-readable copy of the sour …
|
Faq | 64866 | |
|
Is it possible to establish a peer to peer ethernet connection on the 5/6 Series MSO?
Yes. To setup a peer to peer connection, you must manually configure the IP and subnet mask
address on both the scope and your computer. You can then use an ethernet cable connected
directly between the scope and computer. This will work on the Linu …
|
Faq | 474351 | |
|
How do I save and transfer a screenshot from the 4, 5 or 6 Series MSO oscilloscope to my PC
via the remote command interface?
Screenshots (also known as hard copies) can be transferred from the Series 4, 5 and 6 MSO
oscilloscopes via the remote programming interface using just a few simple commands.
For information on how to send commands to the instrument via the remote p …
|
Faq | 245436 | |
|
How many digital channels are supported on the 5 and 6 Series MSO?
Each analog channel on the 5 and 6 Series MSO can be converted into 8 digital channels
with the logic probe TLP058.
For a 4-channel model (MSO54, MSO64), it is up to 32 digital channels.
For a 6-channel model (MSO56), it is up to 48 digital channels …
|
Faq | 468121 | |
|
How to extract the trigger time stamp from a Tektronix .wfm file?
The .wfm waveform files saved from Tektronix DPO/DSA/MSO 5K 7K 70K and 5 and 6 Series MSO
oscilloscopes contains a time stamp that indicates the time that the scope was triggered.
This example program shows how you can extract this time stamp from th …
|
Faq | 471231 | |
|
How do I switch between stacked and overlay display modes on the MSO5 Series?
Double click anywhere in the waveform view screen. A wave form menu will appear. Under
display mode you can pick between overlay or stacked modes.
|
Faq | 474261 | |
|
How do I set up a network drive on my 4, 5, 6 Series MSO?
Introduction
Network drives were introduced in firmware version 1.8.7 for 5 Series, 5 Series Low Profile,
and 6 Series MSOs. This feature allows you to specify a directory on another computer
for the scope to use as storage. To access this storage, …
|
Faq | 773296 | |
|
How do I keep Windows 10 up to date on my scope?
Updating Windows 10 Using Windows Update
By default, Windows 10 will attempt to automatically keep itself up to date with the latest
critical security patches, but it will not install optional updates. To ensure Windows
10 receives all available upd …
|
Faq | 782296 | |
|
I recently registered our Tektronix oscilloscope, updated the firmware and am currently
trying to activate the free DVM & Frequency Counter. I don’t see any software
downloads for activating the DVM. Am I doing something wrong, or looking in the wrong spot?
After you have registered your oscilloscope on Tek.com, you should have received an email
with instructions. The email is sent to the address you used to login to
tek.com. If you haven't received the email after registration:
Check your spam folde …
|
Faq | 468046 | |
|
How can I ungroup the channel badge on the 5/6 Series MSO?
On firmware v1.12 or above, the 5/6 Series MSO added the stacked and overlay mode mix and
match feature. It allows user to group multiple channels for overlay mode for easy
comparison.
To separate the channels in the group, there are couple options …
|
Faq | 773401 | |
|
How can I tell if my 5 Series MSO is running on Windows?
There are three indicators to look for. A Windows scope will have the Applications menu at
the top center of the screen and minimize/maximize/close buttons on the top right. In
addition, if you tap at the bottom of the screen, the Windows Taskbar sho …
|
Faq | 474341 | |
|
How can I invert the channel on the 5 or 6 series MSO?
With firmware v1.16, the invert function is available in the channel menu.
If the unit has the older firmware v1.14 or below, the invert channel feature on the 5
or 6 series MSO is supported via the math channel instead.
Here is the setup procedure: …
|
Faq | 723956 | |
|
I get an error message “CvP Tester Didn’t Run” on my 5 Series MSO.
Instruments that have both a Linux drive and a Windows drive should have the same firmware
revision on both drives.
When only one drive has the latest firmware installed, the instrument user may find that
firmware is not updated on the Linux drive o …
|
Faq | 771991 | |
|
Is e*scope supported on the 5 or 6 series MSO with Windows 10 installed?
Yes. With firmware v1.8 or above, using the web browser access to the
Windows 10 version is supported along with TightVNC. TightVNC must be
installed on both the remote PC and the scope. For the detailed setup
instructions, please see the 5/6 seri …
|
Faq | 474031 | |
|
Does Tektronix have a 12-bit oscilloscope?
Yes! Tektronix offers many different models of real-time oscilloscopes that provide 12-bit
or greater vertical resolution for a variety of applications.
Because many high-vertical-resolution oscilloscopes on the market have technical trade-offs
such …
|
Faq | 69266 | |
|
What is the difference between Position and Offset on an oscilloscope?
To answer this first you need to understand the layout of how your waveform trace is
displayed.
On your oscilloscope you generally will see either 8 or 10 divisions vertically on the
screen.
Along the left side of the screen you will see a marker …
|
Faq | 247211 | |
|
Could the number of analog channel be upgraded on the 5 series MSO?
No. The analog channel count is fixed at the initial purchase.
|
Faq | 468131 | |
|
Can multiple auto measurements be removed at once on the 5 series MSO?
No. Currently, the user interface does not allow to remove all auto measurements at once.
The closest workaround will be recalling the default setup.
|
Faq | 474036 | |
|
Is BUS trigger mode supported in the AB sequence trigger mode on the 5 series MSO?
Yes. However, it does not apply to both events. It could be only either A or B event for
the bus trigger. The second event is locked to edge trigger type.
|
Faq | 474026 | |
|
Where do I start learning about oscilloscopes and Tektronix offerings?
This document covers the basics of oscilloscopes including history and general
operation, in this training presentation developed by a Tektronix Applications Engineer.
Learn the XYZ's of Oscilloscopes »
|
Faq | 778971 | |
|
: Can the optional AFG in the MDO3000, MDO4000C and 5 Series MSO be set to sweep?
AFG in MDO3000, MDO4000C, and 5 Series MSO do not have sweep function. But a limited sweep
may be created using the arbitrary function.
Example: Create a sweep from 100 KHz to 250 KHz.
ArbExpress (free software on Tek.com) select Equation Editor an …
|
Faq | 474056 | |
|
How can I try out optional features for my 5 Series MSO before I buy them?
Most field upgrades for the optional features for the 5 Series MSO are also available for a
one-time, 30-day free trial. These are available simply by requesting a trial software
license and installing the node-locked license in the instrument.
Ther …
|
Faq | 235426 | |
|
How are 5 and 6 Series MSO setup files and session files different? How should I use them?
The 5 and 6 Series MSO setup files contain all instrument settings, user-configured
analysis, and reference waveforms, so they provide an easy way to return the oscilloscope to
a known state. For example, if you want to build a library of standardize …
|
Faq | 235446 | |
|
What user interface differences should I expect to see between a standard 5 or 6 Series MSO
and one equipped with the optional Windows 10 operating system?
When you purchase a 5 Series MSO with the 5-WIN option or a 6 Series MSO with the 6-WIN
option installed, or upgrade your 5 Series MSO with the SUP5-WIN upgrade, or upgrade your 6
Series MSO with the SUP6-WIN upgrade, you will see very few difference …
|
Faq | 235441 | |
|
Where are the controls for Roll Mode displays in my 5 and 6 Series MSO?
Roll Mode provides an instant display response when the oscilloscope is operating at very
slow sweep speeds. Without it, the acquisition must complete before the display will update.
With Horizontal Scale factors as slow as 1000 s/div, that can be a …
|
Faq | 235436 | |
|
I saw a warning message when recalling an instrument setup on my 5 or 6 Series MSO. What
caused it?
The 5 and 6 Series MSO will display a pop-up warning message when it is not completely
successful recalling the saved state of the instrument with a setup or session file.
The following message will appear on the display:
WARNING
The oscilloscope …
|
Faq | 235416 | |
|
Does my 5 or 6 Series MSO support multiple displays?
Yes, the 5 and 6 Series MSO hardware supports a total of three displays, including the
instrument’s internal display. The instrument provides DVI-D, Display Port, and VGA
connectors on the rear panel.
The standard instrument (running the Linux operat …
|
Faq | 250721 | |
|
After I place an order for a software-license or an upgrade for my 5 or 6 Series MSO,
how do I get and install the software license or the upgrade license?
After you place an order for the software license or an upgrade for your 5 or 6 Series MSO,
you will receive an email (at the email address in your MyTek account). It will look about
like this, but customized for you:
Dear Customer (customer@custome …
|
Faq | 235451 | |
|
What optional features are available as upgrades for my 5 Series MSO and how do I get the
upgrade?
Most optional, factory-installed features for the 5 Series MSO are also available as field
upgrades, and are installed simply by ordering an upgrade product and entering a new,
node-locked software license into the instrument.
There are several gene …
|
Faq | 235421 | |
|
How do I upgrade the bandwidth of my 5 Series MSO and what do I get with the upgrade?
Bandwidth upgrades to 500 MHz and 1 GHz can be accomplished by ordering an upgrade product
and entering a new software license into the instrument. The instrument bandwidth appears in
the Help-> About menu near the top of the window, between the Mode …
|
Faq | 235431 | |
|
How do I remotely control my 5 or 6 Series MSO from my computer, easily and without any
programming?
For the standard instrument (without the Windows 10 option installed), you can simply
connect your computer to the instrument through Ethernet and control the oscilloscope with
your favorite browser.
Find the instrument’s IP address by selecting Uti …
|
Faq | 474201 | |
|
Can I mount a network drive on my standard (non-Windows) 5 or 6 Series MSO? How could I use
this capability?
The oscilloscope has a built-in m.2 drive, labeled C:. This drive can be used to store
waveforms, setups, and measurement results. However, this drive is not easily accessible to
your computer.
The oscilloscope also has several USB ports to support …
|
Faq | 474191 | |
|
What does “Probe Dynamic Range” mean and how does the 5 and 6 Series MSO indicate it?
Oscilloscope probes which contain active circuitry, especially with amplifiers in the signal
path, have a limited dynamic range over which the probe behaves linearly. When input signals
exceed this range, the signal may be distorted. (Such probes als …
|
Faq | 474196 | |
|
In-circuit Measurement of Inductors and Transformers with an Oscilloscope
Get a quick review of inductor and transformer theory, and learn how to use an oscilloscope
with power analysis software to perform dynamic inductance measurements under operating
conditions.
|
Application Note | 55W-61401-2 | |
|
Working Remotely with Tektronix Oscilloscopes Running the Windows Operating System
Learn how to work remotely from your oscilloscope by exporting data, offline analysis, using
PC software, custom programming and Windows Remote Desktop. This brief covers oscilloscopes
that run the Windows operating system.
|
Technical Brief | 48W-61700-0 | |
|
Working Remotely with Tektronix Oscilloscopes
Learn how to work remotely from your oscilloscope by exporting data, offline analysis, using
PC software, custom programming and remote access over a LAN. This brief covers
oscilloscopes that do not run the Windows operating system.
|
Technical Brief | 48W-61707-0 | |
|
TekExpress Ethernet (1000BASE-T/ 1000Base-T Multipair, 100BASE-TX and 10BASE-T) Compliance
Solution - 5 and 6 Series MSO - V1.2.2
With TekExpress Ethernet Compliance Test Software, engineers validating an Ethernet physical
layer can perform reliable compliance tests of 10Base-T, 100Base-TX, 1000Base-T and
1000Base-T Multipair technologies in their labs. This application enhanc …
|
Application | 066196757 | |
|
EMI Troubleshooting with the Latest-Generation Oscilloscopes
This application note describes techniques using an oscilloscope that can help you determine
the source of unwanted radiated emissions (EMI), especially after an out-of-limits condition
has been identified through formal testing or pre-compliance tes …
|
Application Note | 48W-61644-1 | |
|
Serial Support Using Tektronix Oscilloscopes and Optional Software
Tektronix oscilloscopes offer a portfolio of optional analysis capabilities to simplify
serial bus debug or compliance verification. This selection matrix shows which serial
standards are supported by each of the oscilloscope series.
|
Selection Guide | 55W-29028-15 | |
|
TekExpress Automotive PAM3 Analysis Application
Automotive Ethernet operates as a full-duplex communication link over a twisted-pair cable.
The Full-Duplex communication, along with PAM3 signaling, adds complexity in validating the
Electronic Control Units (ECU) in real-world conditions. The TekExpress Automotive PAM3
Analysis application includes unique Signal Separation capability and Electrical analysis.
|
User | 077160601 | |
|
Spectrum View: A New Approach to Frequency Domain Analysis on Oscilloscopes
Spectrum View is a new way of performing spectrum analysis on an oscilloscope. This
application note shows and explains how Spectrum View operates and how it differs from
traditional oscilloscope FFT functions.
|
Application Note | 48W-61563-2 | |
|
Power Supply Measurement and Analysis with 4/5/6-PWR Application Software
This application note explains how to set up an oscilloscope to take these measurements with
4-PWR-BAS, 5-PWR and 6-PWR analysis software. It gives a high-level overview of the
various measurements, including power quality, switching loss, and ripple …
|
Application Note | 55W-61294-4 | |
|
TekExpress Automotive PAM3 Analysis Solution - MSO5,MSO6 and MSO6B series - V1.1.0
The Tektronix TekExpress Automotive PAM3 Analysis is an automated test solution for
performing Signal Separation on a Full duplex of 100BASE-T1 and 1000BASE-T1 Automotive
Ethernet signals at system level.User can use this application to perform Signa …
|
Application | 066209600 | |
|
5 SERIES MSO (windows) OS FIRMWARE-V1.26
Download this firmware to install the latest updates for the 5 Series MSO. This firmware
only applies to oscilloscopes that do have option 5-WIN (Windows 10) installed.
|
Firmware | 066196510 | |
|
5 SERIES MSO (non-windows) OS FIRMWARE-V1.26
Download this firmware to install the latest updates for the 5 Series MSO. This firmware
only applies to oscilloscopes that do not have option 5-WIN (Windows 10) installed.
|
Firmware | 066196410 | |
|
Decoding and Searching MIPI I3C Bus Activity with an Oscilloscope
The MIPI I3C standard defines a two-wire interface with a bidirectional data bus for
connecting sensors to an application processor. This application note gives a brief
orientation on the physical layer and packet structures of the I3C protocol. It …
|
Application Note | 48W-61676-0 | |
|
TekExpress Automotive Ethernet (10Base-T1S) Compliance Analysis Solution
This document contains operation information for the TekExpress Automotive Ethernet
(10Base-T1S) Compliance Analysis Solution. It is a PDF version of the help system accessible
in the TekExpress software.
|
Primary User | 077167900 | |
|
TekExpress Automotive Ethernet (10BASE-T1S/100BASE-T1/1000BASE-T1) Automated Compliance
Solution - MSO5 and MSO6 series - V1.3.0
Tektronix TekExpress Automotive Ethernet solution provides automated compliance test support
for 10BASE-T1S (IEEE Std 802.3cg) standard, 100BASE-T1 (IEEE Std.802.3bw) and 1000BASE-T1
(IEEE Std 802.3bp™-2016) standard for Transmitter electrical test …
|
Application | 066208900 | |
|
Automated Low Voltage Differential Signaling (LVDS) Measurements
Low Voltage Differential Signaling (LVDS) is a popular signaling system for applications
requiring high speed data transfers using low power.
|
Application Note | 48W-61639-0 | |
|
5 Series MSO (Windows OS) Firmware - V1.24.9
Download this firmware to install the latest updates for the 5 Series MSO oscilloscopes.
This firmware only applies to oscilloscopes that have option 5-WIN (Windows 10) installed.
|
Firmware | 066196509 | |
|
5 Series MSO (non-Windows) Firmware - V1.24.9
Download this firmware to install the latest updates for the 5 series MSO oscilloscopes.
This firmware only applies to oscilloscopes that do not have option 5-WIN (Windows 10)
installed.
|
Firmware | 066196409 | |
|
Making Higher Accuracy Oscilloscope Measurements
12-bit analog-to-digital converters deliver higher resolution on the 4, 5 and 6 Series MSO
oscilloscopes
Higher resolution oscilloscope measurements are becoming more important given today’s signal
levels. Scopes are available with 12-bit analog-to- …
|
Technical Brief | ||
|
5 Series MSO (MSO54, MSO56, MSO58, MSO58LP)
For firmware version 1.4 and above. This document contains the specifications and
performance verification procedures for the instruments.
|
Performance Verification | 077130605 | |
|
TekExpress Automotive Ethernet (100BASE-T1/1000BASE-T1) Automated Compliance Solution - MSO5
and MSO6 series - V1.2.9
Tektronix TekExpress Automotive Ethernet solution provides automated compliance test support
for 100Base-T1 (IEEE Std.802.3bw) and 1000Base-T1 (IEEE Std 802.3bp™-2016) standard for
Transmitter electrical test specification as per Open Alliance. The …
|
Application | 066186014 | |
|
5 Series MSO (Windows OS) Firmware - V1.22.4
Download this firmware to install the latest updates for the 5 Series MSO oscilloscopes.
This firmware only applies to oscilloscopes that have option 5-WIN (Windows 10) installed.
|
Firmware | 066196507 | |
|
5 Series MSO (non-Windows) Firmware - V1.22.4
Download this firmware to install the latest updates for the 5 series MSO oscilloscopes.
This firmware only applies to oscilloscopes that do not have option 5-WIN (Windows 10)
installed.
|
Firmware | 066196407 | |
|
TekExpress Ethernet Compliance Solution for DPO5000/7000/70000 oscilloscopes
The application provides more visibility into your Ethernet designs with
1000BASE-T/100BASE-TX/10BASE-T PHY measurements as outlined in IEEE 802.3 Section 40, ANSI
X3.263, and IEEE 802.3 Section 14 specific measurements for different Ethernet standards to
the already existing rich tool set of generic jitter, timing, and signal quality
measurements in Tektronix Oscilloscope.
|
User | 077163501 | |
|
Physical Layer Compliance Testing for 1000BASE-T Ethernet
Ethernet compliance testing requires precise test setups and evaluation against limits
dictated by IEEE 802.3 standards. Automated testing software for oscilloscopes greatly
simplifies and speeds testing. This application note summarizes key tests …
|
Application Note | 48W-61620-0 | |
|
TekExpress Ethernet (1000BASE-T,100BASE-TX and 10BASE-T) Compliance Solution - 5 and 6
Series MSO - V1.2.1
With TekExpress Ethernet Compliance Test Software, engineers validating an Ethernet physical
layer can perform reliable compliance tests of 10Base-T, 100Base-TX and 1000Base-T
technologies in their labs. This application enhances efficiency with fast …
|
Application | 066196755 | |
|
4, 5 and 6 Series MSO, 5 and 6 Series Low Profile Digitizers IVI-COM Driver - V1.6.0
TekSeriesScope IVI-COM Driver for 4, 5 and 6 Series Mixed Signal Oscilloscopes; 5 and 6
Series Low Profile Digitizers IVI Scope class-compliant driver. It complies with Scope Class
specifications (IVI-4.1) as defined by the IVI foundation. An IVI cla …
|
Driver | 066192807 | |
|
Tektronix TekExpress LVDS Automated test solution on the 5/6 Series MSO V1.0.0.
The Tektronix TekExpress LVDS transmitter test application offers a physical layer test
solution for transmitter parameter measurements and characterization.
|
Application | 066170911 | |
|
Measuring Power Supply Switching Loss with an Oscilloscope
This application note explains how to measure switching loss and conduction loss in power
supply switches using an oscilloscope equipped with a current probe and differential voltage
probe. It covers both manual and automated techniques, along with p …
|
Application Note | 46W-60010-3 | |
|
TEKVISA Connectivity Software - V4.2.0
TekVISA is the Tektronix implementation of VISA (Virtual Instrument Software Architecture),
an industry-standard communication protocol.When installed on a PC, TekVISA provides
communication with instruments that are connected to the PC via various c …
|
Driver | 066093812 | |
|
TekExpress Industrial Ethernet (10BASE-T1L) Automated Compliance Solution - MSO5 and MSO6
series - V1.0.0
TekExpress Industrial Ethernet Compliance Solution - MSO 5000 and 6000The TekExpress
Industrial Ethernet application (10Base-T1L) is a compliance test solution for performing
transmitter electrical specification measurements and MDI return loss measu …
|
Application | 066203600 | |
|
TekExpress Industrial Ethernet Compliance Solution
This document contains operation information for the TekExpress Industrial Ethernet
Compliance Solution. It is a PDF version of the help system accessible in the TekExpress
software.
|
Primary User | 077162400 | |
|
Characterizing and Troubleshooting Jitter with Your Oscilloscope
Gives examples of jitter analysis, from basic analysis to more advanced jitter decomposition
techniques using the 5 Series Mixed Signal Oscilloscope on unmodulated clocks, spread
spectrum clocks, and serial data.
|
Application Note | 55Z-61099-1 | |
|
TekExpress Automotive PAM3 Analysis Solution - MSO5 and MSO6 series - V1.0.0
The Tektronix TekExpress Automotive PAM3 Analysis is an automated test solution for
performing Signal Separation on a Full duplex 100BASE-T1 Automotive Ethernet signals at
system level. User can perform measurements like eye height and eye width can …
|
Application | 066203300 | |
|
4, 5 and 6 Series Mixed Signal Oscilloscope IVI-COM Driver - V1.5.0
The TekSeriesScope IVI-COM Driver for 4, 5 and 6 Series Mixed Signal Oscilloscopes is an IVI
Scope class-compliant driver. It complies with Scope Class specifications (IVI-4.1) as
defined by the IVI foundation. An IVI class-compliant specific driver …
|
Driver | 066192806 | |
|
5 Series MSO (non-Windows) Firmware - V1.16.6
Download this firmware to install the latest updates for the 5 series MSO oscilloscopes.
This firmware only applies to oscilloscopes that do not have option 5-WIN (Windows 10)
installed.
|
Firmware | 066196405 | |
|
TekExpress Automotive Ethernet (100BASE-T1/1000BASE-T1) Automated Compliance Solution - MSO5
and MSO6 series - V1.2.8
Tektronix TekExpress Automotive Ethernet solution provides automated compliance test support
for 100Base-T1 (IEEE Std.802.3bw) and 1000Base-T1 (IEEE Std 802.3bp?-2016) standard for
Transmitter electrical test specification as per Open Alliance. The …
|
Application | 066186013 | |
|
5 Series MSO (non-Windows) Firmware - V1.14.13
Download this firmware to install the latest updates for the 5 series MSO oscilloscopes.
This firmware only applies to oscilloscopes that do not have option 5-WIN (Windows 10)
installed.
|
Firmware | 066196404 | |
|
TekExpress Automotive Ethernet (100BASE-T1/1000BASE-T1) Automated Compliance Solution - MSO5
and MSO6 series - V1.2.5
The Tektronix TekExpress Automotive Ethernet solution provides automated compliance test
support for 100Base-T1 (IEEE Std.802.3bw) and 1000Base-T1 (IEEE Std 802.3bp™-2016) standard
for Transmitter electrical test specification as per Open Alliance. T …
|
Application | 066186012 | |
|
RM5
This document supports installing Tektronix 5/6 Series instruments in a rackmount kit to fit
in a standard 19-inch equipment rack.
|
Field Install Instructions | 071352302 | |
|
5-CMUSB2, 6-CMUSB2 - 5 Series MSO, 6 Series MSO - V1.2.3
The Tektronix USB2.0 compliance test application (Opt. 5-CMUSB2, Opt. 6-CMUSB2) running on a
5 Series MSO and 6 Series MSO oscilloscope provides a one-button compliance testing for
USB2.0 devices, hosts, and hubs. The USB software automates the compl …
|
Application | 066166808 | |
|
Read This First
This is a reminder to update your instrument with the latest firmware.
|
Field Install Instructions | 061442001 | |
|
5 Series MSO
This manual describes installing and setting up the 5 Series oscilloscope, and introduces
the User Interface and basic oscilloscope operations.
|
User | 071351401 | |
|
Understanding and Performing USB 2.0 Electrical Testing and Debugging
This application note provided an overview of USB 2.0 physical layer testing including
signal quality, in-rush current check, drop and droop tests, as well as tests for high-speed
mode.
|
Application Note | 55W-61400-0 | |
|
1.5 GHz Active Probe
TAP1500 Single-ended Active FET Probe provides excellent high-speed electrical and
mechanical performance required for today's digital system designs.
|
Datasheet | 51W-19043-8 | |
|
Tektronix Demo 3 Board Instruction Manual
This document describes the operation of the Tektronix Demo 3 Board. The Demo 3 board
provides signals to demonstrate key Tektronix instrument features.
|
Training/Tutorials | 071286202 |
The javascript is located in: tekFn.messagesHelper Use the showMessage function Alert Display:<div class="messages"> <div class="messages-content hidden"> <div class="message message-example1"> This is a message-example1 message. </div> <div class="message message-example2"> This is a message-example2 message. </div> <div class="message message-example3"> This is a message-example3 message. </div> </div> <div class="message-container hidden-without-important"> <div class="alert margin-20 alert-dismissable" role="alert"> <span class="close" data-dismiss="alert" aria-label="Close"> <span aria-hidden="true">×</span> </span> </div> </div> </div>Alert Button:<button style="font-size: 13px; color: green;"> <button class="btn btn-primary alert" onclick="messagesHelper.showMessage('danger-alert', true, 'alert-danger');">Danger</button> </button>Alert Button Breakdown: onclick method used to trigger showMessage() showMessage has 3 parameters: 1. showMessage('parameter 1' , true, 'alert-danger'); - References Alert Display message class<div class="message danger-alert"> This is a danger message. </div>2. showMessage('parameter 1',true , 'alert-danger'); - a true or false value indicating whether the message should be cleared before another alert is triggered. 3. showMessage('parameter 1', true,'alert-danger' ); - Type of alert message you want to display. Based on this the alert message will be a different color. List of Alert Types: alert-primary alert-secondary alert-success alert-danger alert-warning alert-info alert-lighter alert-dark
Alert Message Breakdown
<div class="messages-content hidden">messages-content is used to locate the alert message. hidden keeps it from displaying the page before the alert is called.
<div class="message parameter">This is an example message.</div>This is the message displayed in the alert Parameter is used in showMessage(parameter, .. , ..)
<div class="message-container hidden-without-important"> <div class="alert margin-20 alert-dismissable" role="alert"> <span class="close" data-dismiss="alert" aria-label="Close"> <span aria-hidden="true">×</span> </span> </div> </div>Closes the alert window
Example:
As technology invites complexity, advanced applications are pressed to reflect simplicity. See some of the ways Tek experts are supporting the customer, with understanding for the way you work, and innovation to make life easier.
Analog/Digital Design and Debug
No one has time to learn new equipment in the design phase when they are under...
Analog/Digital Design and Debug
No one has time to learn new equipment in the design phase when they are under...
Analog/Digital Design and Debug
No one has time to learn new equipment in the design phase when they are under...
Analog/Digital Design and Debug
No one has time to learn new equipment in the design phase when they are under...
Analog/Digital Design and Debug
No one has time to learn new equipment in the design phase when they are under...
Analog/Digital Design and Debug
No one has time to learn new equipment in the design phase when they are under...
All locations:
- Tektronix Service Centers
- Authorized Service Providers
Contact us
Call
Call us at 1-800-833-9200
Available 6:00 AM – 5:00 PM (PST) Business Days
Download
Download Manuals, Datasheets, Software and more:
Manage it All with CalWeb®

CalWeb from Tektronix delivers the calibration and repair history information you need to the palm of your hand.
Learn About CalWebQuality That Matters

Don't trust your calibrations to just anyone. Only Tektronix provides the breadth of traceable and accredited calibrations that meet your quality program and audit requirements.
View Accreditations and CertificatesViewing 1 of 24 results
Resources
Another lead in statement this time with emphasis lorem ipsum dolor.
Lorem Ipsum
Lorem ipsum dolor sit amet, consectetur adipiscing elit. Sed tempor odio felis, nec scelerisque orci commodo suscipit. Maecenas et nibh rhoncus, sodales turpis vitae, tincidunt lorem. Sed nec lectus.

Дополнительные сведения

Understanding New Developments and Market Requirements for Content Suppliers and Video Service Providers
Major advances in file-based quality control (QC) technology have arrived just in time to provide suppliers of TV programming and motion pictures much-needed assurance that they can keep pace with demand in the fast-moving multiscreen services market.

Tektronix solutions have supported many of humankind’s greatest advances over the past 70 years. With our dedication to confront the challenges to simplicity, velocity, confidence and power, we’ll help innovators achieve in the Digital Age. Here’s a few areas where we’re making these advances. Read more
",
tile_image: " ",
tile_description: "
",
tile_description: "
",
tile_description: "Learn how the path of digital measurement technology is leading to new insights.
", cta_text: "Learn More", cta_url: "http://info.tek.com/www-probes-to-pixels-video-wc.html") }}
",
tile_image: "",
tile_description: "
",
tile_description: "Learn how the path of digital measurement technology is leading to new insights.
", cta_text: "Learn More", cta_url: "http://info.tek.com/www-probes-to-pixels-video-wc.html") }}
",
tile_image: "",
tile_description: "
",
tile_description: "Learn how the path of digital measurement technology is leading to new insights.
", cta_text: "Learn More", cta_url: "http://info.tek.com/www-probes-to-pixels-video-wc.html") }}
",
tile_image: "",
tile_description: "
",
tile_description: "Learn how the path of digital measurement technology is leading to new insights.
", cta_text: "Learn More", cta_url: "http://info.tek.com/www-probes-to-pixels-video-wc.html") }}
",
tile_image: "",
tile_description: "
",
tile_description: "Learn how the path of digital measurement technology is leading to new insights.
", cta_text: "Learn More", cta_url: "http://info.tek.com/www-probes-to-pixels-video-wc.html") }}
",
tile_image: "",
tile_description: "
",
tile_description: "Learn how the path of digital measurement technology is leading to new insights.
", cta_text: "Learn More", cta_url: "http://info.tek.com/www-probes-to-pixels-video-wc.html") }}KickStart Purchasing Options
Select Items to see total below.
-
Suite Apps
- KickStart Suite Apps Bundle
- AFG
- I-V Characterizer
- Scope
- Data Logger
- DMM
- Power Supply
-
-
Speciality Apps
- Battery Simulator
- High Resistivity
- I-V Tracer Software
-
- Maintenance
KickStart Suite Apps Bundle
Software Included
- AFG App
- I-V Characterizer App
- Scope App
- Data Logger App
- DMM App
- Power Supply App
Description
Save money by bundling all the KickStart core software options. Easily complete all your device characterization and datalogging tasks, save tests, and share data for easy collaboration.
Choose your series:
Best Value
Subscription
KICKSTARTFL-SUITE-AN- Pay Annually
- Updates Included with active subscription
US $605
Perpetual
KICKSTARTFL-SUITE- Own the Software
- 1 year of updates included
- Purchase additional updates after 1st year of usage
US $1,510
Best Value
Subscription
KICKSTARTFL-SUITE-AN- Pay Annually
- Updates Included with active subscription
US $605
Perpetual
KICKSTARTFL-SUITE- Own the Software
- 1 year of updates included
- Purchase additional updates after 1st year of usage
US $1,510
Best Value
Subscription
KICKSTARTFL-SUITE-AN- Pay Annually
- Updates Included with active subscription
US $605
Perpetual
KICKSTARTFL-SUITE- Own the Software
- 1 year of updates included
- Purchase additional updates after 1st year of usage
US $1,510
AFG
Description
The KickStart AFG App gives users a simple method to control the AFG by sourcing and previewing waveforms remotely. Use the AFG App in conjunction with other KickStart apps, such as the Scope App, to capture signal data. Change settings in real time with our responsive interface along with accessing a variety of source functions, including pulse, noise, arbitrary, exponential rise, and many more
Choose your series:
Best Value
Subscription
KICKSTARTFL-SUITE-AN- Pay Annually
- Updates Included with active subscription
US $605
Perpetual
KICKSTARTFL-SUITE- Own the Software
- 1 year of updates included
- Purchase additional updates after 1st year of usage
US $1,510
Best Value
Subscription
KICKSTARTFL-SUITE-AN- Pay Annually
- Updates Included with active subscription
US $605
Perpetual
KICKSTARTFL-SUITE- Own the Software
- 1 year of updates included
- Purchase additional updates after 1st year of usage
US $1,510
Best Value
Subscription
KICKSTARTFL-SUITE-AN- Pay Annually
- Updates Included with active subscription
US $605
Perpetual
KICKSTARTFL-SUITE- Own the Software
- 1 year of updates included
- Purchase additional updates after 1st year of usage
US $1,510
I-V Characterizer
Description
Use the I-V Characterizer App to perform current vs. voltage (I-V) test on a variety of materials, two-terminal and multi-terminal semiconductor devices, solar cells, and much more. You can configure each SMU for a variety of bias and sweep sourcing operations, including linear, log, list, and dual sweeps.
Configure and control up to four instruments for DC or Pulsed I-V test in either the same app, same project, or a combination of the two while performing current versus voltage (I-V) testing on a variety of materials and devices
Subscription
KICKSTARTFL-IVC-AN- Pay Annually
- Updates Included with active subscription
US $223
Perpetual
KICKSTARTFL-IVC- Own the Software
- 1 year of updates included
- Purchase additional updates after 1st year of usage
US $551
Scope
Description
The Scope app supports data retrieval from Analog Channels, Reference Channels and Math Channels. The app will either capture present data (without waiting for a trigger) or will arm the scope to wait for a trigger, stop the capture to gather data once scope has been triggered and re-arm scope to wait for next trigger after data is captured.
Enable data capture and datalogging of waveforms, measurements, and screenshots with threee modes of operation while also capturing present data or arm to wait for a trigger, capture data, and re-arm for next trigger
Subscription
KICKSTARTFL-SCOPE-AN- Pay Annually
- Updates Included with active subscription
US $150
Perpetual
KICKSTARTFL-SCOPE- Own the Software
- 1 year of updates included
- Purchase additional updates after 1st year of usage
US $369
Data Logger
Description
Use the KickStart Data Logger App to set up and control your multi-channel data acquisition instrument. This app is designed to help you configure all your channels very quickly and even validate your connections during test configuration. It allows you to set up multiple channels with the same configuration but give each channel a meaningful label so that you can quickly scan your results and grab the information you need. Configure pass/fail limits for each channel in order to set alarm conditions and obtain quick visual verification of test results.Quickly configure multi-channel data acquisition instruments, stream millions of readings directly to PC disk media for safe data archival, and automatically export data in ready-to-use formats for reports and additional analysis.
Subscription
KICKSTARTFL-DL-AN- Pay Annually
- Updates Included with active subscription
US $182
Perpetual
KICKSTARTFL-DL- Own the Software
- 1 year of updates included
- Purchase additional updates after 1st year of usage
US $423
DMM
Description
This app affords you a simple way to log data using your Keithley DMM or sensitive measurement instrument.
Run independent or simultaneous tests that log measurements from one or more DMMs and get a quick summary of data using statistics built into the data table
Subscription
KICKSTARTFL-DMM-AN- Pay Annually
- Updates Included with active subscription
US $182
Perpetual
KICKSTARTFL-DMM- Own the Software
- 1 year of updates included
- Purchase additional updates after 1st year of usage
US $423
Power Supply
Description
This app simplifies supplying power to your device or system. Export / save statistics with the data while having easy access to control voltage bias and current limit while viewing data from primary measurement instrument in main viewing area. Configure list sweeps to automate tests of up to 99 points on the power supply. Control channels individually on multi-channel power supplies.
Subscription
KICKSTARTFL-PS-AN- Pay Annually
- Updates Included with active subscription
US $182
Perpetual
KICKSTARTFL-PS- Own the Software
- 1 year of updates included
- Purchase additional updates after 1st year of usage
US $418
Battery Simulator
Description
We provide a simple method to create, manage, and simulate battery models along with the ability to cycle test batteries. Designed for use with Keithley instruments to simulate battery models, battery model generation, and battery charge/discharge cycle testing.
Subscription
KICKSTARTFL-BAT-AN- Pay Annually
- Updates Included with active subscription
US $395
Perpetual
KICKSTARTFL-BAT- Own the Software
- 1 year of updates included
- Purchase additional updates after 1st year of usage
US $988
High Resistivity
Description
Measure resistance up to 1018Ω at up to 1000V, quickly and reliably determine resistivity of material using tests that conform to ASTM D257 standard. For the most accurate resistivity measurements use alternating polarity measurement technique to eliminate inherent background currents.
Subscription
KICKSTARTFL-HRMA2-AN- Pay Annually
- Updates Included with active subscription
US $418
Perpetual
KICKSTARTFL-HRMA2- Own the Software
- 1 year of updates included
- Purchase additional updates after 1st year of usage
US $1,020
I-V Tracer Software
Description
Leverage the unique touchscreen interface of the 2400 Series Source Measure Unit (SMU) instrument to recreate the familiar user experience of a curve tracer for two-terminal devices. This gives a dedicated user interface for tracing the characteristics of devices through both current and voltage. With a range of compatible instruments, the I-V Tracer app can utilize the full capabilities of each source measure unit.
Permanent License
One-time purchase, node-locked, updates included.
KICKSTARTNL-ACT1 US $1,850
KICKSTARTNL-ACT3 US $4,960
KICKSTARTNL-ACT5 US $6,200
Maintenance
Description
Perpetual License Only
All perpetual-licensed software comes with 1 year of updates. Maintenance plans add 1 year of updates to existing Perpetual License for one year increments after 1st year of software purchase.
KICKSTARTFL-SUITE-UP US $225
KICKSTARTFL-AFG-UP US $49
KICKSTARTFL-IVC-UP US $97
KICKSTARTFL-SCOPE-UP US $59
KICKSTARTFL-DL-UP US $85
KICKSTARTFL-DMM-UP US $85
KICKSTARTFL-PS-UP US $82
KICKSTARTFL-HRMA2-UP US $164
KICKSTARTFL-BAT-UP US $151
Selected Items
Total
US $0
Account Required In order to continue with your transaction, you would need to have a Tektronix account. Thank you.
KickStart Purchasing Options
Select Items to see total below.
KickStart Suite Apps Bundle (*required option)
Software Included
- AFG App
- I-V Characterizer App
- Scope App
- Data Logger App
- DMM App
- Power Supply App
Description
Save money by bundling all the KickStart core software options. Easily complete all your device characterization and datalogging tasks, save tests, and share data for easy collaboration.
Choose your series:
Best Value
Subscription
KICKSTARTFL-SUITE-AN- Pay Annually
- Updates Included with active subscription
US $605
Perpetual
KICKSTARTFL-SUITE- Own the Software
- 1 year of updates included
- Purchase additional updates after 1st year of usage
US $1,510
Best Value
Subscription
KICKSTARTFL-SUITE-AN- Pay Annually
- Updates Included with active subscription
US $605
Perpetual
KICKSTARTFL-SUITE- Own the Software
- 1 year of updates included
- Purchase additional updates after 1st year of usage
US $1,510
Best Value
Subscription
KICKSTARTFL-SUITE-AN- Pay Annually
- Updates Included with active subscription
US $605
Perpetual
KICKSTARTFL-SUITE- Own the Software
- 1 year of updates included
- Purchase additional updates after 1st year of usage
US $1,510
AFG (*required option)
Description
The KickStart AFG App gives users a simple method to control the AFG by sourcing and previewing waveforms remotely. Use the AFG App in conjunction with other KickStart apps, such as the Scope App, to capture signal data. Change settings in real time with our responsive interface along with accessing a variety of source functions, including pulse, noise, arbitrary, exponential rise, and many more
Choose your series:
Best Value
Subscription
KICKSTARTFL-SUITE-AN- Pay Annually
- Updates Included with active subscription
US $605
Perpetual
KICKSTARTFL-SUITE- Own the Software
- 1 year of updates included
- Purchase additional updates after 1st year of usage
US $1,510
Best Value
Subscription
KICKSTARTFL-SUITE-AN- Pay Annually
- Updates Included with active subscription
US $605
Perpetual
KICKSTARTFL-SUITE- Own the Software
- 1 year of updates included
- Purchase additional updates after 1st year of usage
US $1,510
Best Value
Subscription
KICKSTARTFL-SUITE-AN- Pay Annually
- Updates Included with active subscription
US $605
Perpetual
KICKSTARTFL-SUITE- Own the Software
- 1 year of updates included
- Purchase additional updates after 1st year of usage
US $1,510
I-V Characterizer
Description
Use the I-V Characterizer App to perform current vs. voltage (I-V) test on a variety of materials, two-terminal and multi-terminal semiconductor devices, solar cells, and much more. You can configure each SMU for a variety of bias and sweep sourcing operations, including linear, log, list, and dual sweeps.
Configure and control up to four instruments for DC or Pulsed I-V test in either the same app, same project, or a combination of the two while performing current versus voltage (I-V) testing on a variety of materials and devices
Subscription
KICKSTARTFL-IVC-AN- Pay Annually
- Updates Included with active subscription
US $223
Perpetual
KICKSTARTFL-IVC- Own the Software
- 1 year of updates included
- Purchase additional updates after 1st year of usage
US $551
Scope
Description
The Scope app supports data retrieval from Analog Channels, Reference Channels and Math Channels. The app will either capture present data (without waiting for a trigger) or will arm the scope to wait for a trigger, stop the capture to gather data once scope has been triggered and re-arm scope to wait for next trigger after data is captured.
Enable data capture and datalogging of waveforms, measurements, and screenshots with threee modes of operation while also capturing present data or arm to wait for a trigger, capture data, and re-arm for next trigger
Subscription
KICKSTARTFL-SCOPE-AN- Pay Annually
- Updates Included with active subscription
US $150
Perpetual
KICKSTARTFL-SCOPE- Own the Software
- 1 year of updates included
- Purchase additional updates after 1st year of usage
US $369
Data Logger
Description
Use the KickStart Data Logger App to set up and control your multi-channel data acquisition instrument. This app is designed to help you configure all your channels very quickly and even validate your connections during test configuration. It allows you to set up multiple channels with the same configuration but give each channel a meaningful label so that you can quickly scan your results and grab the information you need. Configure pass/fail limits for each channel in order to set alarm conditions and obtain quick visual verification of test results.Quickly configure multi-channel data acquisition instruments, stream millions of readings directly to PC disk media for safe data archival, and automatically export data in ready-to-use formats for reports and additional analysis.
Subscription
KICKSTARTFL-DL-AN- Pay Annually
- Updates Included with active subscription
US $182
Perpetual
KICKSTARTFL-DL- Own the Software
- 1 year of updates included
- Purchase additional updates after 1st year of usage
US $423
DMM
Description
This app affords you a simple way to log data using your Keithley DMM or sensitive measurement instrument.
Run independent or simultaneous tests that log measurements from one or more DMMs and get a quick summary of data using statistics built into the data table
Subscription
KICKSTARTFL-DMM-AN- Pay Annually
- Updates Included with active subscription
US $182
Perpetual
KICKSTARTFL-DMM- Own the Software
- 1 year of updates included
- Purchase additional updates after 1st year of usage
US $423
Power Supply
Description
This app simplifies supplying power to your device or system. Export / save statistics with the data while having easy access to control voltage bias and current limit while viewing data from primary measurement instrument in main viewing area. Configure list sweeps to automate tests of up to 99 points on the power supply. Control channels individually on multi-channel power supplies.
(Select as many as you like)
MSO44 4-BW-100|OPT MSO44 4-BW-100|OPT MSO44 4-BW-100|OPT MSO44 4-BW-100|OPT MSO44 4-BW-100|OPT + US $100
MSO44 4-BWB-1000|OPT + US $1000
MSO44 4-BW-10000|OPT + US $10 000
Low Voltage differential Probes
Battery Simulator
Description
We provide a simple method to create, manage, and simulate battery models along with the ability to cycle test batteries. Designed for use with Keithley instruments to simulate battery models, battery model generation, and battery charge/discharge cycle testing.
Subscription
KICKSTARTFL-BAT-AN- Pay Annually
- Updates Included with active subscription
US $395
Perpetual
KICKSTARTFL-BAT- Own the Software
- 1 year of updates included
- Purchase additional updates after 1st year of usage
US $988
High Resistivity
Description
Measure resistance up to 1018Ω at up to 1000V, quickly and reliably determine resistivity of material using tests that conform to ASTM D257 standard. For the most accurate resistivity measurements use alternating polarity measurement technique to eliminate inherent background currents.
- Lorem Ipsum is simply dummy text of the printing and typesetting industry. Lorem Ipsum has been the industry's standard dummy text ever since the 1500s
- Lorem Ipsum is simply dummy text of the printing and typesetting industry. Lorem Ipsum has been the industry's standard dummy text ever since the 1500s
- Lorem Ipsum is simply dummy text of the printing and typesetting industry. Lorem Ipsum has been the industry's standard dummy text ever since the 1500s
- Lorem Ipsum is simply dummy text of the printing and typesetting industry. Lorem Ipsum has been the industry's standard dummy text ever since the 1500s
- Lorem Ipsum is simply dummy text of the printing and typesetting industry. Lorem Ipsum has been the industry's standard dummy text ever since the 1500s
Remote Teaching with eScope
Tektronix enables many of its oscilloscopes and bench instruments to be remotely accessed and controlled. Our IP-based capability on oscilloscopes, called eScope, provides the flexibility of remotely setting up a lab instrument and enabling students to make real-time measurements. Equally important, it provides a virtual front panel which helps students experience how to use industry instruments, even if they have to learn remotely.
Subscription
KICKSTARTFL-BAT-AN- Pay Annually
- Updates Included with active subscription
US $395
Perpetual
KICKSTARTFL-BAT- Own the Software
- 1 year of updates included
- Purchase additional updates after 1st year of usage
US $988
Remote Teaching with eScope 1
Tektronix enables many of its oscilloscopes and bench instruments to be remotely accessed and controlled. Our IP-based capability on oscilloscopes, called eScope, provides the flexibility of remotely setting up a lab instrument and enabling students to make real-time measurements. Equally important, it provides a virtual front panel which helps students experience how to use industry instruments, even if they have to learn remotely.
Subscription
KICKSTARTFL-BAT-AN- Pay Annually
- Updates Included with active subscription
Node-locked
1 YearUS $395
Perpetual
KICKSTARTFL-BAT- Own the Software
- 1 year of updates included
- Purchase additional updates after 1st year of usage
Node-locked
US $988Perpetual
KICKSTARTFL-BAT- Own the Software
- 1 year of updates included
- Purchase additional updates after 1st year of usage
Node-locked
US $988Remote Teaching with eScope 2
Tektronix enables many of its oscilloscopes and bench instruments to be remotely accessed and controlled. Our IP-based capability on oscilloscopes, called eScope, provides the flexibility of remotely setting up a lab instrument and enabling students to make real-time measurements. Equally important, it provides a virtual front panel which helps students experience how to use industry instruments, even if they have to learn remotely.
Subscription
KICKSTARTFL-BAT-AN- Pay Annually
- Updates Included with active subscription
US $395
Perpetual
KICKSTARTFL-BAT- Own the Software
- 1 year of updates included
- Purchase additional updates after 1st year of usage
US $988
Remote Teaching with eScope 3
Tektronix enables many of its oscilloscopes and bench instruments to be remotely accessed and controlled. Our IP-based capability on oscilloscopes, called eScope, provides the flexibility of remotely setting up a lab instrument and enabling students to make real-time measurements. Equally important, it provides a virtual front panel which helps students experience how to use industry instruments, even if they have to learn remotely.
Subscription
KICKSTARTFL-BAT-AN- Pay Annually
- Updates Included with active subscription
1 Year
US $395
US $395
3 Years
US $395
US $395
Perpetual
KICKSTARTFL-BAT- Own the Software
- 1 year of updates included
- Purchase additional updates after 1st year of usage
Node-locked
US $988I-V Tracer Software
Description
Leverage the unique touchscreen interface of the 2400 Series Source Measure Unit (SMU) instrument to recreate the familiar user experience of a curve tracer for two-terminal devices. This gives a dedicated user interface for tracing the characteristics of devices through both current and voltage. With a range of compatible instruments, the I-V Tracer app can utilize the full capabilities of each source measure unit.
Permanent License
One-time purchase, node-locked, updates included.
KICKSTARTNL-ACT3 US $4,960
KICKSTARTNL-ACT5 US $6,200
KICKSTARTNL-ACT3 US $4,960
KICKSTARTNL-ACT5 US $6,200
Maintenance
Description
Perpetual License Only
All perpetual-licensed software comes with 1 year of updates. Maintenance plans add 1 year of updates to existing Perpetual License for one year increments after 1st year of software purchase.
KICKSTARTFL-SUITE-UP US $225
KICKSTARTFL-AFG-UP US $49
KICKSTARTFL-IVC-UP US $97
KICKSTARTFL-SCOPE-UP US $59
KICKSTARTFL-DL-UP US $85
KICKSTARTFL-DMM-UP US $85
KICKSTARTFL-PS-UP US $82
KICKSTARTFL-HRMA2-UP US $164
KICKSTARTFL-BAT-UP US $151
Selected Items
Total
US $0
Account Required In order to continue with your transaction, you would need to have a Tektronix account. Thank you.
Get End to End Measurement Accuracy
Learn how the path of digital measurement technology is leading to new insights.
Get End to End Measurement Accuracy
Learn how the path of digital measurement technology is leading to new insights.
Get End to End Measurement Accuracy
Learn how the path of digital measurement technology is leading to new insights.
Capturing in UHD
Camera operators face the first challenge of the 4K transition, as HDR production requires more attention during acquisition than SDR production. Whether you’re filming live UHD content like a football game, or episodic UHD content like a TV series, you’ll find familiar measurement tools and advanced analytics with Tektronix. Tektronix’s patented Stop Display allows you to instantly check the dynamic range of shooting, regardless of camera type—whether SDR, HDR, or both—simplifying the process of monitoring a wide variety of different camera gammas and HDR specifications like ST2084 PQ and HLG.
eBook: Understanding the Challenges of Creating 4K Content

This is a caption.
Capturing in UHD
Camera operators face the first challenge of the 4K transition, as HDR production requires more attention during acquisition than SDR production. Whether you’re filming live UHD content like a football game, or episodic UHD content like a TV series, you’ll find familiar measurement tools and advanced analytics with Tektronix. Tektronix’s patented Stop Display allows you to instantly check the dynamic range of shooting, regardless of camera type—whether SDR, HDR, or both—simplifying the process of monitoring a wide variety of different camera gammas and HDR specifications like ST2084 PQ and HLG.
eBook: Understanding the Challenges of Creating 4K Content
This is a caption.
Learning Center
Learn Source Measure Unit (SMU) basics – from individual concepts to key industrial applications such as how to use the SMU in a 2 terminal and 3 terminal device test to obtain IV curves and how an SMU can simplify the test setup and increase productivity.Software for your Source Measure Unit
Start sourcing and measuring in minutes, and develop your next application test.Video
 5:50
5:50
How to use Callouts on the 4 Series, 5 Series and 6 Series Oscilloscopes
03/10/2020App/Ind
Webinar
Fundamentals of Signal Integrity Webinar
03/10/2020Speakers
Professor A, Professor B
App/Ind
Case Study
TDS5000B Aids Panasonic Communications with Automatic Inspection of Laser Scanning Units
03/10/2020Subject
Solution
Advantages
App/Ind
Case Study
TDS5000B Aids Panasonic Communications with Automatic Inspection of Laser Scanning Units
03/10/2020Subject
Solution
Advantages
App/Ind
Case Study
TDS5000B Aids Panasonic Communications with Automatic Inspection of Laser Scanning Units
03/10/2020Subject
Solution
Advantages
App/Ind
Case Study
TDS5000B Aids Panasonic Communications with Automatic Inspection of Laser Scanning Units
03/10/2020Subject
Solution
Advantages
App/Ind
Case Study
TDS5000B Aids Panasonic Communications with Automatic Inspection of Laser Scanning Units
03/10/2020Subject
Solution
Advantages
App/Ind
Video
5:50
How to use Callouts on the 4 Series, 5 Series and 6 Series Oscilloscopes
03/10/2020App/Ind
Video
5:50
How to use Callouts on the 4 Series, 5 Series and 6 Series Oscilloscopes
03/10/2020App/Ind
Video
5:50
How to use Callouts on the 4 Series, 5 Series and 6 Series Oscilloscopes
03/10/2020App/Ind
Video
5:50
How to use Callouts on the 4 Series, 5 Series and 6 Series Oscilloscopes
03/10/2020App/Ind
Video
5:50
How to use Callouts on the 4 Series, 5 Series and 6 Series Oscilloscopes
03/10/2020App/Ind
Learning Center
Analyze your most challenging system designs by adding one of our 30+ packages to your oscilloscopeHTML needed for loader:
The loader itself:
      <div id="loader-one" class="loader-container" style="display: none;">
        <div class="loader"></div>
      </div>
A sample button to activate it:
<button class="btn btn-primary compare-submit">Toggle Loader</button>
A sample button logic that uses a global tekFn object:
      // == Event Listener ==
      $('button.compare-submit').on("click", showHideLoader);
      // == Actions ===
      function showHideLoader() {
        var $loader = $('#loader-one');
        (!$loader.hasClass('active')) ?
          window.tekFn.loader('show','#loader-one')+$loader.addClass('active') :
          window.tekFn.loader('hide','#loader-one')+$loader.removeClass('active');
      }
Loader JS usage
PatternLab does now allow support for 'window' variable, so when this function is to be used on Sitecore it should be used as:
window.tekFn.loader(...)
without underscore unlike how it is in Source Code of this page.
Click the buttons below to add or remove loaders to assigned DIVs.
How to use JS method of adding a loader:
window.tekFn.loader('appendTo','.example--container-div-multiple');
window.tekFn.loader('remove', '.example--container-div-multiple .loader-container');
Click to view Calibration Service Levels
Calibration Service Levels - APPEND (click and BG changes to lightblue)
If you know the type of calibration service you need, please enter it here. If you are unsure, our customer service representatives will help you identify the correct level of calibration to meet your requirements.
Standard Calibration (ANSI/NCSL Z540.1)Services compliant with this standard provide a calibration certificate with a calibration date and calibration due date. A traceability statement is provided. Measurement parameters not meeting the test specifications (out of tolerance) are identified and reported on the certificate.
Standard Calibration (ANSI/NCSL Z540.1) with DataServices compliant with this standard provide a calibration certificate with a calibration date and calibration due date.A traceability statement is provided. Complete before/after measurement data is provided, listing the test name, measured value and test limits for each parameter tested during the calibration process.
17025 Calibration ServiceInstrumentation is calibrated in accordance with ISO/IEC 17025 within our approved scope of accreditation.Accredited calibrations provide a certificate of calibration with the accrediting body's logo on the document.The calibration date is on the certificate; calibration due date is only placed on the document when specified by the customer or contractually agreed.A traceability statement is provided. Measurement data and uncertainty for each parameter tested during the calibration is provided.
| Model | Analog Bandwidth | Sample Rate | Record Length | Analog Channels | Digital Channels | Spectrum Analyzer | Function Generator Output | List Price |
|---|---|---|---|---|---|---|---|---|
| MDO3012 | 100 MHz | 2.5 GS/s | 10 Mpoints | 2 | 16 (optional) | Up to 3 GHz | 1 (optional) |
US $3,450 Configure & Quote |
| MDO3014 | 100 MHz | 2.5 GS/s | 10 Mpoints | 4 | 16 (optional) | Up to 3 GHz | 1 (optional) |
US $4,110 Configure & Quote |
| MDO3014 | 100 MHz | 2.5 GS/s | 10 Mpoints | 4 | 16 (optional) | Up to 3 GHz | 1 (optional) |
US $4,110 Configure & Quote |
| MDO3022 | 200 MHz | 2.5 GS/s | 10 Mpoints | 2 | 16 (optional) | Up to 3 GHz | 1 (optional) |
US $4,120 Configure & Quote |
| MDO3024 | 200 MHz | 2.5 GS/s | 10 Mpoints | 4 | 16 (optional) | Up to 3 GHz | 1 (optional) |
US $4,590 Configure & Quote |
| MDO3032 | 350 MHz | 2.5 GS/s | 10 Mpoints | 2 | 16 (optional) | Up to 3 GHz | 1 (optional) |
US $7,110 Configure & Quote |
| MDO3034 | 350 MHz | 2.5 GS/s | 10 Mpoints | 4 | 16 (optional) | Up to 3 GHz | 1 (optional) |
US $8,550 Configure & Quote |
| MDO3052 | 500 MHz | 2.5 GS/s | 10 Mpoints | 2 | 16 (optional) | Up to 3 GHz | 1 (optional) |
US $9,020 Configure & Quote |
| MDO3102 | 1 GHz | 5 GS/s | 10 Mpoints | 2 | 16 (optional) | Up to 3 GHz | 1 (optional) |
US $10,800 Configure & Quote |
| MDO3054 | 500 MHz | 2.5 GS/s | 10 Mpoints | 4 | 16 (optional) | Up to 3 GHz | 1 (optional) |
US $11,500 Configure & Quote |
| MDO3104 | 1 GHz | 5 GS/s | 10 Mpoints | 4 | 16 (optional) | Up to 3 GHz | 1 (optional) |
US $14,300 Configure & Quote |
Contact us
Download
Download
Download Manuals, Datasheets, Software and more:
Arbitrary Function Generator
Today's designs are often complex, demanding a variety of stimulus signals during test. With standard waveforms, arbitrary waveform capability and signal impairment options, a Tektronix Function Generator supports a wide range of application needs with one instrument. Best-in-class Function Generator performance from Tektronix AFGs ensures signals are accurately reproduced. See more signal generators »
Compare Tektronix Arbitrary Function Generators
| Compare | Model | Analog Channels | Sample Rate | Bandwidth | Vertical Resolution | Record Length | Output Frequency Range | Starting Price |
|---|---|---|---|---|---|---|---|---|
|
|
2 |
125 MS/s - 300 MS/s |
25 MHz - 60 MHz |
14-bit |
8k points - 1M points |
25 MHz - 60 MHz |
US $929
|
|
|
|
1 |
250 MS/s |
20 MHz |
14-bit |
128k points |
20 MHz |
US $1,680
|
|
|
|
1 - 2 |
250 MS/s - 2 GS/s |
10 MHz - 240 MHz |
14-bit |
128k points |
10 MHz - 240 MHz |
US $2,470
|
|
|
|
1 - 2 |
250 MS/s - 2 GS/s |
25 MHz - 250 MHz |
14-bit |
16 MSa/ch |
25 MHz - 250 MHz |
US $2,210
|
Recommended Probes:
P6015A
LIST PRICE
US $2,180
Bandwidth
Maximum Voltage
Rise Time
75 MHz
20 kV
4.0 ns
P6015A
LIST PRICE
US $2,180
Bandwidth
Maximum Voltage
Rise Time
75 MHz
20 kV
4.0 ns
P6015A
LIST PRICE
US $2,180
Bandwidth
Maximum Voltage
Rise Time
75 MHz
20 kV
4.0 ns
P6015A
LIST PRICE
US $2,180
Bandwidth
Maximum Voltage
Rise Time
75 MHz
20 kV
4.0 ns


Product series comparison

|

|
|
|
|
| abc12345 | abc12346 | abc12347 | abc12348 | |
| Bandwidth |
30 MHz - 200 MHz |
1 GHz - 8 GHz |
30 MHz - 200 MHz |
1 GHz - 8 GHz |
| Trigger Types |
Edge, Video, Pulse Width |
Edge, Glitch, Runt, Width, Timeout, Visual Trigger, Transition, Window, Setup/Hold, Pattern, State, I2C, SPI, CAN, CAN FD, LIN, FlexRay, SENT, SPMI, MIL-STD-1553, ARINC 429, RS-232/422/485/UART, USB 2.0, Ethernet, Audio |
Edge, Video, Pulse Width |
Edge, Glitch, Runt, Width, Timeout, Visual Trigger, Transition, Window, Setup/Hold, Pattern, State, I2C, SPI, CAN, CAN FD, LIN, FlexRay, SENT, SPMI, MIL-STD-1553, ARINC 429, RS-232/422/485/UART, USB 2.0, Ethernet, Audio |
| Automated Measurements |
16 to 34 |
36 |
16 to 34 |
36 |
| Rise Time |
7.0 ns - 2.1 ns |
400 ps - 50 ps (1 GHz - 8 GHz) |
7.0 ns - 2.1 ns |
400 ps - 50 ps (1 GHz - 8 GHz) |
| Analog Channels |
2-4 |
4 |
2-4 |
4 |
| Sample Rate |
1 GS/s - 2 GS/s |
25 GS/s |
1 GS/s - 2 GS/s |
25 GS/s |
| Record Length |
2.5k points |
62.5 - 250 Mpoints |
2.5k points |
62.5 - 250 Mpoints |
| Display |
5.7 in (145 mm) to 7 in (177.8 mm), Color |
15.6 in. (396 mm), Color |
5.7 in (145 mm) to 7 in (177.8 mm), Color |
15.6 in. (396 mm), Color |
| Warranty |
5-year Warranty |
Three-year Warranty |
5-year Warranty |
Three-year Warranty |
| Digital Channels | - |
Up to 32 (optional) |
- |
Up to 32 (optional) |
| Spectrum Analyzer | - |
- |
- |
- |
| Function Generator Output | - |
1 (optional) |
- |
1 (optional) |
| Maximum Waveform Capture Rate | - |
>500,000 (Peak Detect, Envelope acquisition mode), |
- |
>500,000 (Peak Detect, Envelope acquisition mode), |
| Optional Analysis | - |
Advanced Jitter And Eye Diagram Analysis (6-DJA), Advanced Power Measurements (6-PWR), Automotive Ethernet Compliance (6-CMAUTOEN), CAN/CAN FD/LIN/FlexRay Serial Triggering and Analysis (6-SRAUTO), DDR3/LPDDR3 Debug and Analysis (6-DBDDR3), Ethernet Compliance (6-CMENET), Ethernet Serial Triggering and Analysis (6-SRENET), I2C/SPI Embedded Serial Triggering and Analysis (6-SREMBD), I2S/LJ/RJ/TDM Audio Serial Triggering and Analysis (6-SRAUDIO), MIL-STD-1553/ARINC 429 Serial Triggering and Analysis (6-SRAERO), MIPI D-PHY Compliance (6-CMDPHY), RS-232/422/485/UART Serial Triggering and Analysis (6-SRCOMP), SENT Serial Triggering and Analysis (6-SRAUTOSEN), SPMI Serial Triggering and Analysis (6-SRPM), USB 2.0 Compliance (6-CMUSB2), USB 2.0 Serial Triggering and Analysis (6-SRUSB2) |
- |
Advanced Jitter And Eye Diagram Analysis (6-DJA), Advanced Power Measurements (6-PWR), Automotive Ethernet Compliance (6-CMAUTOEN), CAN/CAN FD/LIN/FlexRay Serial Triggering and Analysis (6-SRAUTO), DDR3/LPDDR3 Debug and Analysis (6-DBDDR3), Ethernet Compliance (6-CMENET), Ethernet Serial Triggering and Analysis (6-SRENET), I2C/SPI Embedded Serial Triggering and Analysis (6-SREMBD), I2S/LJ/RJ/TDM Audio Serial Triggering and Analysis (6-SRAUDIO), MIL-STD-1553/ARINC 429 Serial Triggering and Analysis (6-SRAERO), MIPI D-PHY Compliance (6-CMDPHY), RS-232/422/485/UART Serial Triggering and Analysis (6-SRCOMP), SENT Serial Triggering and Analysis (6-SRAUTOSEN), SPMI Serial Triggering and Analysis (6-SRPM), USB 2.0 Compliance (6-CMUSB2), USB 2.0 Serial Triggering and Analysis (6-SRUSB2) |
| Vertical Accuracy | - |
50 Ω: ±1.0% of full scale, (±2.0% of full scale at 1mV/div), 1 MΩ: ±0.5% of full scale, (±1.0% of full scale at 1mV/div and 500µV/div) |
- |
50 Ω: ±1.0% of full scale, (±2.0% of full scale at 1mV/div), 1 MΩ: ±0.5% of full scale, (±1.0% of full scale at 1mV/div and 500µV/div) |
| No. Of Application Modules Range | - |
n/a |
- |
n/a |
| SA Real Time Capture Bandwidth | - |
n/a |
- |
n/a |
| Starting Price | US $470 | Contact Us | US $470 | Contact Us |
Product series comparison
|
|
|
|
|
|
| TBS1000 | 6 Series MSO | TBS1000C | 6 Series MSO | |
| Bandwidth |
30 MHz - 200 MHz |
1 GHz - 8 GHz |
30 MHz - 200 MHz |
1 GHz - 8 GHz |
| Trigger Types |
Edge, Video, Pulse Width |
Edge, Glitch, Runt, Width, Timeout, Visual Trigger, Transition, Window, Setup/Hold, Pattern, State, I2C, SPI, CAN, CAN FD, LIN, FlexRay, SENT, SPMI, MIL-STD-1553, ARINC 429, RS-232/422/485/UART, USB 2.0, Ethernet, Audio |
Edge, Video, Pulse Width |
Edge, Glitch, Runt, Width, Timeout, Visual Trigger, Transition, Window, Setup/Hold, Pattern, State, I2C, SPI, CAN, CAN FD, LIN, FlexRay, SENT, SPMI, MIL-STD-1553, ARINC 429, RS-232/422/485/UART, USB 2.0, Ethernet, Audio |
| Automated Measurements |
16 to 34 |
36 |
16 to 34 |
36 |
| Rise Time |
7.0 ns - 2.1 ns |
400 ps - 50 ps (1 GHz - 8 GHz) |
7.0 ns - 2.1 ns |
400 ps - 50 ps (1 GHz - 8 GHz) |
| Analog Channels |
2-4 |
4 |
2-4 |
4 |
| Sample Rate |
1 GS/s - 2 GS/s |
25 GS/s |
1 GS/s - 2 GS/s |
25 GS/s |
| Record Length |
2.5k points |
62.5 - 250 Mpoints |
2.5k points |
62.5 - 250 Mpoints |
| Display |
5.7 in (145 mm) to 7 in (177.8 mm), Color |
15.6 in. (396 mm), Color |
5.7 in (145 mm) to 7 in (177.8 mm), Color |
15.6 in. (396 mm), Color |
| Warranty |
5-year Warranty |
Three-year Warranty |
5-year Warranty |
Three-year Warranty |
| Digital Channels | - |
Up to 32 (optional) |
- |
Up to 32 (optional) |
| Spectrum Analyzer | - |
- |
- |
- |
| Function Generator Output | - |
1 (optional) |
- |
1 (optional) |
| Maximum Waveform Capture Rate | - |
>500,000 (Peak Detect, Envelope acquisition mode), |
- |
>500,000 (Peak Detect, Envelope acquisition mode), |
| Optional Analysis | - |
Advanced Jitter And Eye Diagram Analysis (6-DJA), Advanced Power Measurements (6-PWR), Automotive Ethernet Compliance (6-CMAUTOEN), CAN/CAN FD/LIN/FlexRay Serial Triggering and Analysis (6-SRAUTO), DDR3/LPDDR3 Debug and Analysis (6-DBDDR3), Ethernet Compliance (6-CMENET), Ethernet Serial Triggering and Analysis (6-SRENET), I2C/SPI Embedded Serial Triggering and Analysis (6-SREMBD), I2S/LJ/RJ/TDM Audio Serial Triggering and Analysis (6-SRAUDIO), MIL-STD-1553/ARINC 429 Serial Triggering and Analysis (6-SRAERO), MIPI D-PHY Compliance (6-CMDPHY), RS-232/422/485/UART Serial Triggering and Analysis (6-SRCOMP), SENT Serial Triggering and Analysis (6-SRAUTOSEN), SPMI Serial Triggering and Analysis (6-SRPM), USB 2.0 Compliance (6-CMUSB2), USB 2.0 Serial Triggering and Analysis (6-SRUSB2) |
- |
Advanced Jitter And Eye Diagram Analysis (6-DJA), Advanced Power Measurements (6-PWR), Automotive Ethernet Compliance (6-CMAUTOEN), CAN/CAN FD/LIN/FlexRay Serial Triggering and Analysis (6-SRAUTO), DDR3/LPDDR3 Debug and Analysis (6-DBDDR3), Ethernet Compliance (6-CMENET), Ethernet Serial Triggering and Analysis (6-SRENET), I2C/SPI Embedded Serial Triggering and Analysis (6-SREMBD), I2S/LJ/RJ/TDM Audio Serial Triggering and Analysis (6-SRAUDIO), MIL-STD-1553/ARINC 429 Serial Triggering and Analysis (6-SRAERO), MIPI D-PHY Compliance (6-CMDPHY), RS-232/422/485/UART Serial Triggering and Analysis (6-SRCOMP), SENT Serial Triggering and Analysis (6-SRAUTOSEN), SPMI Serial Triggering and Analysis (6-SRPM), USB 2.0 Compliance (6-CMUSB2), USB 2.0 Serial Triggering and Analysis (6-SRUSB2) |
| Vertical Accuracy | - |
50 Ω: ±1.0% of full scale, (±2.0% of full scale at 1mV/div), 1 MΩ: ±0.5% of full scale, (±1.0% of full scale at 1mV/div and 500µV/div) |
- |
50 Ω: ±1.0% of full scale, (±2.0% of full scale at 1mV/div), 1 MΩ: ±0.5% of full scale, (±1.0% of full scale at 1mV/div and 500µV/div) |
| No. Of Application Modules Range | - |
n/a |
- |
n/a |
| SA Real Time Capture Bandwidth | - |
n/a |
- |
n/a |
| Starting Price | US $470 | Contact Us | US $470 | Contact Us |
Product series comparison
|
|
|
|
|
|
| 3 Series MDO Mixed Domain Oscilloscope | 4 Series MSO Mixed Signal Oscilloscope | 5 Series MSO | 5 Series MSO Low Profile | |
| Bandwidth |
100 MHz - 1 GHz |
200 MHz to 1.5 GHz |
350 MHz - 2 GHz |
1 GHz - 1 GHz |
| Automated Measurements |
44 |
34 |
36 ,36 |
36 |
| Analog Channels |
2 or 4 |
4 or 6 |
4 - 8 |
8 |
| Display |
11.6 inches, 1920 x 1080 HD |
13.3 in, 1920x1080 HD |
15.6 in. (396 mm), Color |
- |
| Digital Channels |
16 (optional) |
Up to 48 (optional) |
Up to 64 (optional) |
Up to 64 (optional) |
| List Price | $306 | $578 | $643 | $643 |
Model
MDO3012
New!
List Price
US $3,450
Buy Online
Configure & Quote
Analog Bandwidth
Sample Rate
Record Length
100 MHz
2.5 GS/s
10 Mpoints
Analog Channels
Digital Channels
Spectrum Analyzer
2
16 (optional)
Up to 3 GHz
Model
MDO3012
New!
List Price
US $3,450
Buy Online
Configure & Quote
Analog Bandwidth
Sample Rate
Record Length
100 MHz
2.5 GS/s
10 Mpoints
Analog Channels
Digital Channels
Spectrum Analyzer
2
16 (optional)
Up to 3 GHz
Model
MDO3012
New!
List Price
US $3,450
Buy Online
Configure & Quote
Analog Bandwidth
Sample Rate
Record Length
100 MHz
2.5 GS/s
10 Mpoints
Analog Channels
Digital Channels
Spectrum Analyzer
2
16 (optional)
Up to 3 GHz
Model
MDO3012
New!
List Price
US $3,450
Buy Online
Configure & Quote
Analog Bandwidth
Sample Rate
Record Length
100 MHz
2.5 GS/s
10 Mpoints
Analog Channels
Digital Channels
Spectrum Analyzer
2
16 (optional)
Up to 3 GHz
Model
MDO3012
New!
List Price
US $3,450
Buy Online
Configure & Quote
Analog Bandwidth
Sample Rate
Record Length
100 MHz
2.5 GS/s
10 Mpoints
Analog Channels
Digital Channels
Spectrum Analyzer
2
16 (optional)
Up to 3 GHz
Model
MDO3012
New!
List Price
US $3,450
Buy Online
Configure & Quote
Analog Bandwidth
Sample Rate
Record Length
100 MHz
2.5 GS/s
10 Mpoints
Analog Channels
Digital Channels
Spectrum Analyzer
2
16 (optional)
Up to 3 GHz
Oscilloscope Probes and Accessories
Choose from a broad portfolio of Tektronix probes and accessories, all perfectly matched to our industry-leading oscilloscopes. With over 100 choices available, select the oscilloscope probe you need for your specific testing application.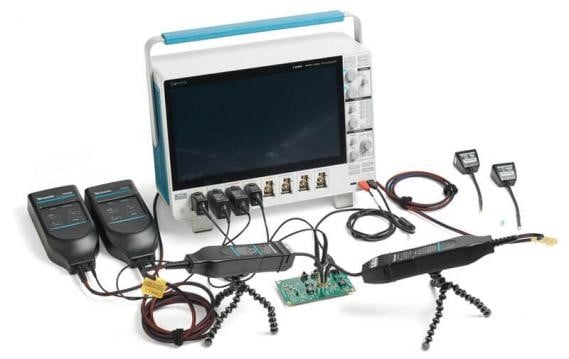
IsoVu Isolated Probes
Probing systems make high-resolution measurements in the presence of common mode signals or noise.
IsoVu Isolated Probes
Probing systems make high-resolution measurements in the presence of common mode signals or noise.
IsoVu Isolated Probes
Probing systems make high-resolution measurements in the presence of common mode signals or noise.
IsoVu Isolated Probes
Probing systems make high-resolution measurements in the presence of common mode signals or noise.
IsoVu Isolated Probes
Probing systems make high-resolution measurements in the presence of common mode signals or noise.
IsoVu Isolated Probes
Probing systems make high-resolution measurements in the presence of common mode signals or noise.
Introducing two next-gen scopes.
Built for every engineer, every day.
New Series

3 Series MDO Mixed Domain Oscilloscope
New Series
3 Series MDO Mixed Domain Oscilloscope
New Series
3 Series MDO Mixed Domain Oscilloscope
Compare and choose the best oscilloscope for your use
Learning Center
Analyze your most challenging system designs by adding one of our 30+ packages to your oscilloscopeSearch for your exact product here:
See all that we offer
Software for your
Oscilloscope
Analyze your most challenging system designs by adding one of our 30+ packages to your oscilloscope
Analysis Software for Oscilloscopes
Analyze your most challenging system designs by adding one of our 30+ packages to your oscilloscope
Analysis Software for Oscilloscopes
Analyze your most challenging system designs by adding one of our 30+ packages to your oscilloscope

Whether it was using your dad's scope in the garage in high school, analyzing your first waveform in college, the project you're currently working on or something you're planning to make in the future - we want to know about it.
Selu / Women in Technology
#TekScopeStory #TekOneMillion
Bandwidth
Up to1.5GHz
Record Length
Up to62.5M
Analog Channels
4or6
Vertical Resolution
12bits
Product registration will be associated with the name and address from your online account.
Please review our Privacy Notice for more details.
Search
1 - 10 out
of 2659
Refine Your Result
- Document (1150)
- Promotions (20)
- Drivers, Firmware & Software (468)
- FAQs (355)
- Events (40)
- Oscilloscope (235)
- Probe & Accessories (468)
- Keithley Products (123)
- Analyzers (236)
Search Results
-
Product Series MDO4000C Mixed Domain Oscilloscope
6–in–1 Versatility PLUS High Performance in One Powerful Oscilloscope
Request a QuoteLast Update: 2018-11-29
-
Software Analysis Software for Oscilloscopes
Request a QuoteLast Update: 2017-10-15
-
Manual 2230 Oscilloscope Operators Primary User
DownloadLast Update: 2018-10-15
-
Product Series MDO4000C Mixed Domain Oscilloscope
6–in–1 Versatility PLUS High Performance in One Powerful Oscilloscope
Request a QuoteLast Update: 2018-11-29
-
Software Analysis Software for Oscilloscopes
Request a QuoteLast Update: 2017-10-15
-
Manual 2230 Oscilloscope Operators Primary User
DownloadLast Update: 2018-10-15
Filter By Type
- Products (5)
- Datasheet (245)
- Manual (45)
- Software (147)
- FAQ (104)
- Technical Document (95)
- Videos, Webinars and Demos (63)
- Blog Entry (31)
- Articles (1)
Product Support Center
Find the latest firmware, software, drivers, manuals, brochures. specifications and technical literature.
Learning Center
Learn how to use our equipment to troubleshoot system anomalies, provide measurement insights, debug EMI, and more.
Search Results
1 - 10 out of 736
-

-
Manual
4/5/6 Series MSO Primary User
Download this manualPrimary User | P/N 077130315 | Date: Friday, June 25 2021
-
Software
6 SERIES MSO (NON-WINDOWS) FIRMWARE - V1.32.2
Firmware | P/N 066198512 | Date: Friday, May 21 2021


Filter By Type
- My Favorites
- Products (6)
- Datasheet (246)
- Manual (47)
- Software (149)
- FAQ (104)
- Technical Document (94)
- Videos, Webinars and Demos (63)
- Blog Entry (31)
- Articles (1)
Product Support Center
Find the latest firmware, software, drivers, manuals, brochures. specifications and technical literature.
Learning Center
Learn how to use our equipment to troubleshoot system anomalies, provide measurement insights, debug EMI, and more.
Search Results
1 - 10 out of 736
-
-
Manual
4/5/6 Series MSO Primary User
Download this manualPrimary User | P/N 077130315 | Date: Friday, June 25 2021
-
Software
6 SERIES MSO (NON-WINDOWS) FIRMWARE - V1.32.2
Firmware | P/N 066198512 | Date: Friday, May 21 2021
Extend Your Warranty,
Extend Your Peace of Mind
Extended warranties for the 6 Series start at
US $2,120 3 yr. plan
| Service Plan Feature | Total Protection (Opt. T3, T5) | Gold Care (Opt. G3, G5) | Keithley Care (Opt. EW, 3Y-EW, 5Y-EW) | Tek Care (Opt. R3, R5) |
|---|---|---|---|---|
| Extension of factory warranty |  | | | |
| Protection from manufacturer defects | | | | |
| Free factory certified calibration with repair (if necessary) | | | | |
| Free in-country shipping | | | | |
| Priority on-bench service | | | ||
| Coverage of user-caused EOS and ESD damage | | | ||
| Coverage from accidental damage | | |||
| Coverage from normal wear and tear | | |||
| Loaner unit during repair shipped within 48 hours | |
Maintain Compliance with an Instrument Calibration Plan
Instrument calibration plans for the MSO 6 start at
US $2,790 3 yr. plan
| Calibration Features: | Z540 Calibration1 | ISO 17025 Compliant1 | ISO 17025 Accredited |
|---|---|---|---|
| Certificate of calibration and calibration label designed to meet audit requirements | | | |
| Firmware updates, if applicable, along with safety and reliability updates ² | | | |
| OEM procedures for measurements ² | | | |
| Test data | Optional | | |
| Calibration record retention | | | |
| Traceability | | | |
| Uncertainty analysis | | | |
| Independent verification by a ISO/IEC accredited organization (with logo on certificate) | |
| Product/Option | Description |
|---|---|
| Keithley Opt. 3Y-STD | KEITHLEYCARE 3 YR STD CALIBRATION PLAN. 3Y provides for 3 calibration events during 3 years after shipment. |
| Keithley Opt. 3Y-DATA | KEITHLEYCARE 3 YR CALIBRATION W/DATA PLAN. 3Y provides for 3 calibration events during 3 years after shipment. |
| Keithley Opt. 5Y-STD | KEITHLEYCARE 5 YR STD CALIBRATION PLAN. 5Y provides for 5 calibration events during 5 years after shipment. |
| Keithley Opt. 5Y-DATA | KEITHLEYCARE 5 YR CALIBRATION W/DATA PLAN. 5Y provides for 5 calibration events during 5 years after shipment. |
| Keithley Opt. 3Y-17025 | KEITHLEYCARE 3 YR ISO 17025 CALIBRATION PLAN. 3Y provides for 3 calibration events during 3 years after shipment. |
| Keithley Opt. 5Y-17025 | KEITHLEYCARE 5 YR ISO 17025 CALIBRATION PLAN. 5Y provides for 5 calibration events during 5 years after shipment. |
| Tektronix Opt. C3 | Calibration service 3 years. C3 provides for 2 calibration events during 3 years after shipment. Includes traceable calibration or functional verification where applicable, for recommended calibrations. Coverage includes the initial calibration plus 2-years calibration coverage. |
| Tektronix Opt. C5 | Calibration service 5 years. C5 provides for 4 calibration events during 5 years after shipment. Includes traceable calibration or functional verification where applicable, for recommended calibrations. Coverage includes the initial calibration plus 4-years calibration coverage. |
Need to Calibrate More than Just Your MSO6?
Tektronix is a leading accredited calibration services provider for all brands of electronic test and measurement equipment, servicing more than 140,000 models from 9,000 manufacturers. With 100+ labs worldwide, Tektronix serves as your global partner delivering tailored calibration programs with OEM quality at a market price. Onsite, local pickup and delivery, and other options available.


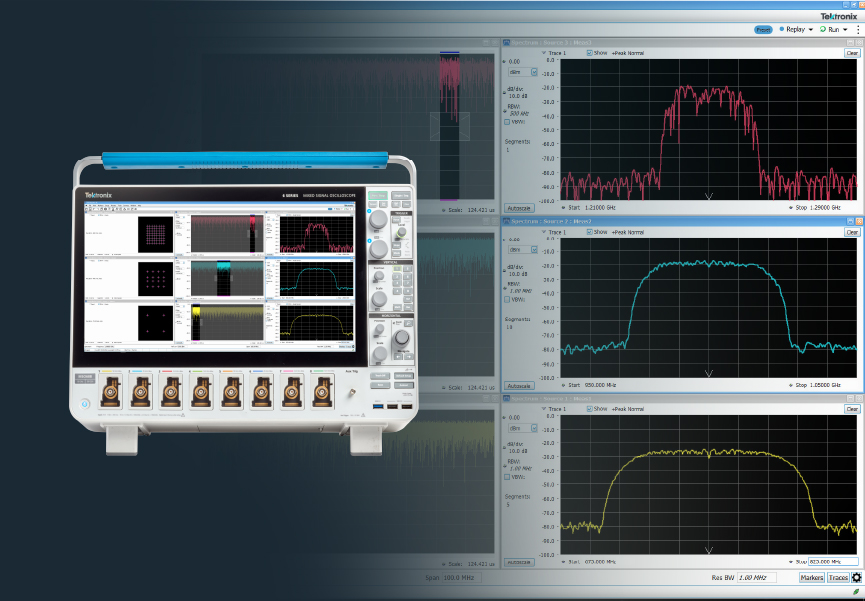

Watch 6 reasons to choose the 6 Series MSO
Watch 6 reasons to choose the 6 Series MSO
- Basic Scope Timelapse
- 6 Series MSO Commercial_E
- Making Basic 2-Port Measurements Using the TTR500 VNA
- Youku Video Sample

Simplify Your Current-Voltage Measurements
Duration 1:26
Watch the video to see how a Keithley source measure unit (SMU) instrument...
Simplify
Duration 1:26
Watch the video to see how a Keithley source measure unit (SMU) instrument...
Simplify Your
Duration 1:26
Watch the video to see how a Keithley source measure unit (SMU) instrument...
Simplify Your Current-Voltage
Duration 1:26
Watch the video to see how a Keithley source measure unit (SMU) instrument...
Kickstart Suite Bundle
$460
Subscription
$1,130
Perpetual
Includes the following Apps:
- I-V Characterizer
- Scope App
- Data Logger
- DMM
- Power Supply
- Includes 1 Year of Maintenance
Select license option to continue
KickStart Individual Apps
- Purchase the App or Apps you need individually
- Licensing options to fit your budget
- Includes 1 Year of Maintenance
I-V Characterizer
$790
Subscription
$1,990
Perpetual
Select license option to continue
Scope
$790
Subscription
$1,990
Perpetual
Select license option to continue
Data Logger
$790
Subscription
$1,990
Perpetual
Select license option to continue
DMM
$790
Subscription
$1,990
Perpetual
Select license option to continue
Power Supply
$790
Subscription
$1,990
Perpetual
Select license option to continue
Kickstart Specialty Apps
- The optional high resistivity application for KickStart is designed for use with Keithley’s 6517B Electrometer/ High Resistance Meter.
- Keithley I-V Tracer Software leverages the unique touchscreen interface of the 2400 Series Graphical SourceMeter® Source Measure Unit (SMU) instruments to recreate the familiar user experience of a curve tracer for two-terminal devices.
- Includes 1 Year of Maintenance
High Resistivity
$790
Subscription
$1,990
Perpetual
Select license option to continue
I-V Tracer
US $1,560 - US $5,200
Select license option to continue
Maintenance Plans
About Tektronix Software Licensing
Apply to perpetual licenses only. A maintenance license is an extension license that extends the period of support of an original perpetual license for 12 months.
Note: Perpetual licenses include maintenance for the first year but will require a new maintenance license every 12 months to continue to receive updates after the first year.
Suite Bundle Maintenance

US $1,560
I-V Characterizer Maintenance
US $1,560
Scope Maintenance
US $1,560
Data Logger Maintenance
US $1,560
DMM Maintenance
US $1,560
Power Supply Maintenance
US $1,560
High Resistivity Maintenance
US $1,560
Starter
$790
Purchase a License
$1,990
Perpetual
- Serial Trigger
- Decode
- Search and event table analysis on I2C
- SPI
- RS-232/422/485/UART buses
Integrated Arbitrary Function Generator with 13 predefined waveform types as well as arbitrary waveforms up to 50 MHz
Select license option
Pro
$790
Purchase a License
$1,990
Perpetual
- Includes Starter Bundle
- Adds 250M/ch record length
- Includes 1 year of maintenance
PLUS: Choose a bundle
Serial Trig / Decode
- CAN, LIN, FlexRay
- USB2.0
- eUSB
- Ethernet
- I3C
- NRZ
- SPMI
- MDIO
- SVID
- 8b/10b
- Audio
Select license option to continue
Power
- Advanced Power
- Analysis
- Digital Power
- Management Analysis
- Inverter & Motor Drive Analysis
- Serial T/D
- SPMI
- SVID
Select license option to continue
Signal Integrity
- Jitter Analysis
- PAM3 Analysis*
- LVDS Debug*
- DDR3 Debug
- Mask/Limit Testing
Select license option to continue
Compliance
- 10/100/1000* BaseT Ethernet
- 2.5G/5G/10G* BaseT Ethernet*
- Industrial Ethernet*
- USB2.0*
Select license option to continue
Automotive
- Jitter Analysis
- PAM3 Analysis*
- Signal Separation*
- 10BaseT1 and 10BaseT1S Compliance*
- MIPHY DPHY Compliance*
- Inverter and Motor Drive Analysis
- Serial T/D
- CAN, CAN FD, FIN, Flexray
- SENT
- PSI5
- I3C
Select license option to continue
Mil / Gov
- Jitter Analysis
- Mask/Limit Testing
- Serial T/D
- Mil-Std-1553
- ARINC429
- Spacewire
- NRZ
Select license option to continue
Ultimate
$790
Purchase a License
$1,990
Perpetual
- Includes Starter Bundle
- Includes Pro Bundle
- Includes 1 Year of Maintenance
- Spectrum View RF vs. Time waveforms
- Extended Spectrum View capture bandwidth
- Video Trigger
Select license option to continue
Contact us
Live Chat with Tek representatives. Available 6:00 AM - 4:30 PM PST.
Downloads
Download Manuals, Datasheets, Software and more:
Feedback
Contact us
Live Chat with Tek representatives. Available 6:00 AM - 4:30 PM PST.
Downloads
Download Manuals, Datasheets, Software and more:
Feedback
Read Online
Oscilloscope Sections
CHAPTER 3
Evaluating Oscilloscopes
- Introduction
- Ease-of-UseThe Complete Measurement System Probes
- Bandwidth
- Rise Time
- Sample Rate
- A Note About Bandwidth and Sample RateWaveform Capture Rate
- Record Length
- Triggering Capabilities
- Effective Bits
- Frequency Response
- Vertical Sensitivity
- Sweep Speed
- Gain Accuracy
- Horizontal Accuracy (Time Base)
- Vertical Resolution (Analog-to-Digital Converter)
- Timing Resolution Mixed Signal Oscilloscopes (MSO)
- Connectivity
- Expandability
Oscilloscope Basics: Waveforms, Graph, & Measurement Reading
Waveform and Signal Analysis
Nearly all consumer products today have electronic circuits. Whether a product is simple or complex, if it includes electronic components, the design, verification, and debugging process requires an oscilloscope to analyze the numerous electrical signals that make the product come to life.
Understanding oscilloscope basics is critical to almost all product design.

What exactly is an oscilloscope, anyway? Quite simply, an oscilloscope is a diagnostic instrument that draws a graph of an electrical signal. This simple graph can tell you many things about a signal, such as:
- The time and voltage values of a signal.
- The frequency of an oscillating signal.
- The "moving parts" of a circuit represented by the signal.
- The frequency with which a particular portion of the signal occurs relative to other portions.
- Whether or not a malfunctioning component is distorting the signal.
- How much of a signal is direct current (DC) or alternating current (AC).
- How much of the signal is noise and whether the noise is changing with time.
The Oscilloscope's Graph
At the most basic level, an oscilloscope's graph of an electrical signal shows how the signal changes over time (Figure 2):
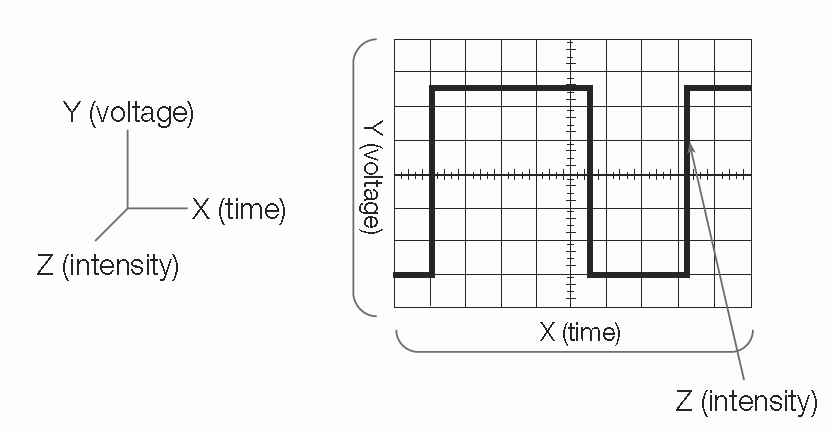
Figure 2: X, Y, and Z components of a displayed waveform.
The intensity or brightness of the display is sometimes called the Z-axis. In Digital Phosphor Oscilloscopes (DPO), the Z-axis can be represented by color grading of the display (Figure 3).
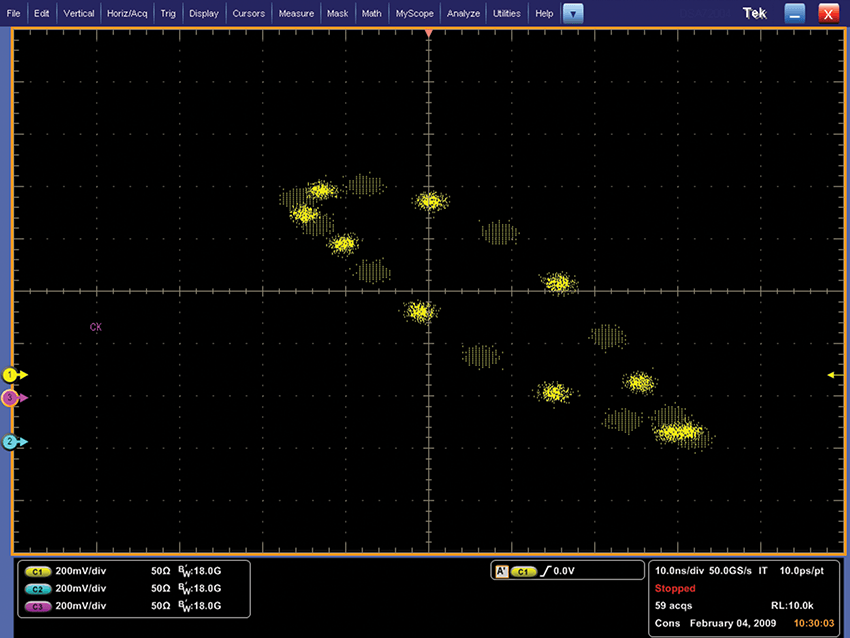
Figure 3:Two offset clock patterns with Z axis intensity grading.
The Significance of Signal Integrity
A key benefit of an oscilloscope is its ability to accurately reconstruct a signal. The better the reconstruction of the signal the higher the signal integrity. Here's one way to think of signal integrity. An oscilloscope is analogous to a camera that captures signal images that you then observe and interpret. Several key issues lie at the heart of signal integrity:
- When you take a picture, is it an accurate representation of what actually happened?
- Is the picture clear or fuzzy?
- How many accurate pictures can you take per second?
The different systems and performance capabilities of an oscilloscope contribute to its ability to deliver the highest signal integrity possible. Probes also affect the signal integrity of a measurement system.
This primer helps you understand all of these elements so you can choose and use the oscilloscope appropriate for your application. Before you begin evaluating oscilloscopes, you need to understand the basics of waveforms and waveform measurements.
This information is covered in this chapter. It's the foundation of putting an oscilloscope to work for you.
Understanding Waveforms and Waveform Measurements
The generic term for a pattern that repeats over time is a wave. Sound waves, brain waves, ocean waves,
and voltage waves are all repetitive patterns. An oscilloscope measures voltage waves. A waveform is a graphic representation of a wave.
Physical phenomena such as vibrations, temperature, or electrical phenomena such as current or power can be converted to a voltage by a sensor. One cycle of a wave is the portion of the wave that repeats. A voltage waveform shows time on the horizontal axis and voltage on the vertical axis.
Waveform shapes reveal a great deal about a signal. Any time you see a change in the height of the waveform, you know the voltage has changed. Any time there is a flat horizontal line, you know that there is no change for that length of time.
Straight, diagonal lines mean a linear change; a rise or fall of voltage at a steady rate. Sharp angles on a waveform indicate sudden change. Figure 4 shows common waveforms.
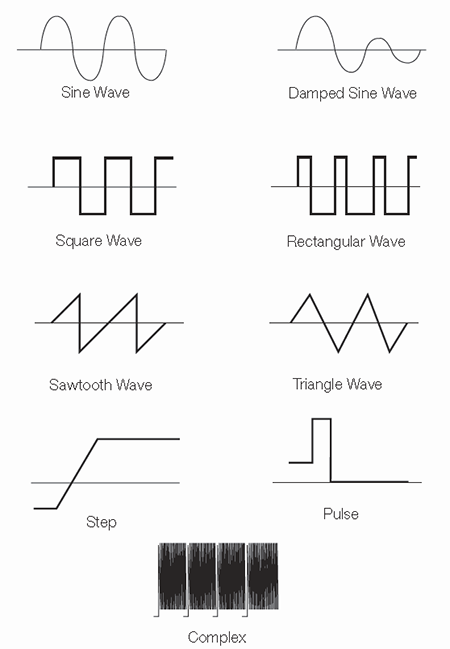
Figure 4:Common waveforms
Figure 5 displays sources of common waveforms, such as electrical outlets, computers, automobiles, and televisions.
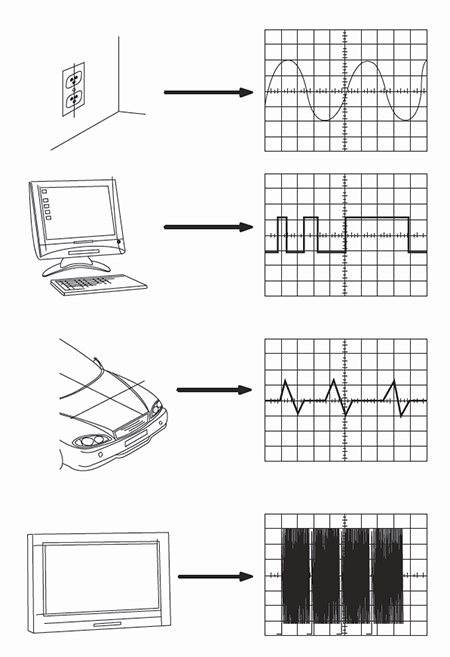
Figure 5: Sources of common waveforms
Types of Waves
You can classify most waves into these types:
- Sine waves.
- Square and rectangular waves.
- Sawtooth and triangle waves.
- Step and pulse shapes.
- Periodic and non-periodic signals.
- Synchronous and asynchronous signals.
- Complex waves.
Next we'll look at each of these types of waves.
Sine Waves
The sine wave is the fundamental wave shape for several reasons. It has harmonious mathematical properties"€it is the same sine shape you may have studied in trigonometry class.
The voltage in a wall outlet varies as a sine wave. Test signals produced by the oscillator circuit of a signal generator are often sine waves.
Most AC power sources produce sine waves (AC signifies alternating current, although the voltage alternates too; DC stands for direct current, which means a steady current and voltage, such as a battery produces.) The damped sine wave is a special case you may see in a circuit that oscillates, but winds down over time.
Square and Rectangular Waves
The square wave is another common wave shape. Basically, a square wave is a voltage that turns on and off (or goes high and low) at regular intervals. It is a standard wave for testing amplifiers. Good amplifiers increase the amplitude of a square wave with minimum distortion.
Television, radio, and computer circuitry often use square waves for timing signals. The rectangular wave is like the square wave except that the high and low time intervals are not of equal length. It is particularly important when analyzing digital circuitry.
Sawtooth and Triangle Waves
Sawtooth and triangle waves result from circuits designed to control voltages linearly, such as the horizontal sweep of an analog oscilloscope or the raster scan of a television.
The transitions between voltage levels of these waves change at a constant rate. These transitions are called ramps.
Step and Pulse Shapes
Signals such as steps and pulses that occur rarely, or non-periodically, are called single-shot or transient signals.
A step indicates a sudden change in voltage, similar to the voltage change you see if you turn on a power switch.
A pulse indicates sudden changes in voltage, similar to the voltage changes you see if you turn a power switch on and then off again. A pulse might represent one bit of information traveling through a computer circuit or it might be a glitch, or defect, in a circuit.
A collection of pulses traveling together creates a pulse train. Digital components in a computer communicate with each other using pulses. These pulses may be in the form of a serial data stream or multiple signal lines may be used to represent a value in a parallel data bus. Pulses are also common in x-ray, radar, and communications equipment.
Periodic and Non-periodic Signals
Repetitive signals are referred to as periodic signals, while signals that constantly change are known as non-periodic signals. A still picture is analogous to a periodic signal, while a movie is analogous to a non-periodic signal.
Synchronous and Asynchronous Signals
When a timing relationship exists between two signals, those signals are referred to as synchronous. Clock, data, and address signals inside a computer are examples of synchronous signals.
Asynchronous signals are signals between which no timing relationship exists. Because no time correlation exists between the act of touching a key on a computer keyboard and the clock inside the computer, these signals are considered asynchronous.
Complex Waves
Some waveforms combine the characteristics of sines, squares, steps, and pulses to produce complex wave shapes. The signal information may be embedded in the form of amplitude, phase, and/or frequency variations.
For example, although the signal in Figure 6 is an ordinary composite video signal, it is composed of many cycles of higher-frequency waveforms embedded in a lower-frequency envelope.
In this example, it is important to understand the relative levels and timing relationships of the steps. To view this signal, you need an oscilloscope that captures the low-frequency envelope and blends in the higher-frequency waves in an intensity-graded fashion so that you can see their overall combination as an image you can interpret visually.
Digital phosphor oscilloscopes (DPOs) are best suited to viewing complex waves, such as the video signals shown in Figure 6. Their displays provide the necessary frequency-of-occurrence information, or intensity grading, that is essential to understanding what the waveform is really doing.
Some oscilloscopes can display certain types of complex waveforms in special ways. For example, telecommunications data may be displayed as an eye pattern or a constellation diagram:

Figure 6: An NTSC composite video signal is an example of a complex wave.
Telecommunications digital data signals can be displayed on an oscilloscope as a special type of waveform referred to as an eye pattern. The name comes from the similarity of the waveform to a series of eyes (Figure 7).
Eye patterns are produced when digital data from a receiver is sampled and applied to the vertical input, while the data rate is used to trigger the horizontal sweep. The eye pattern displays one bit or unit interval of data with all possible edge transitions and states superimposed in one comprehensive view.

Figure 7: 622 Mb/s serial data eye pattern.
A constellation diagram is a representation of a signal modulated by a digital modulation scheme such as quadrature amplitude modulation or phase-shift keying.

Constellation Diagram.
Waveform Measurements
Many terms are used to describe the types of measurements you make with an oscilloscope. Next we'll look at some of the most common measurements and terms.
Frequency and Period
If a signal repeats, it has a frequency. Frequency is measured in Hertz (Hz) and is the number of times the signal repeats itself in one second. This is also referred to as cycles per second.
A repetitive signal also has a period, which is the amount of time it takes the signal to complete one cycle.
Period and frequency are reciprocals of each other, so that:

Figure 8: Frequency and period of a sine wave.
Voltage
Voltage is the amount of electric potential, or signal strength, between two points in a circuit. Usually, one of these points is ground, or zero volts, but not always. You may want to measure the voltage from the maximum peak to the minimum peak of a waveform, referred to as the peak-to-peak voltage.
Amplitude
Amplitude is the amount of voltage between two points in a circuit. Amplitude commonly refers to the maximum voltage of a signal measured from ground, or zero volts. The waveform shown in Figure 9 has an amplitude of 1 V and a peak-to-peak voltage of 2 V.

Figure 9: Amplitude and degrees of a sine wave.
Phase
Phase is best explained by looking at a sine wave. The voltage level of sine waves is based on circular motion. Given that a circle has 360°, one cycle of a sine wave has 360°, as shown in Figure 10.
Using degrees, you can refer to the phase angle of a sine wave when you want to describe how much of the period has elapsed.
Phase shift describes the difference in timing between two otherwise similar signals. The waveform in Figure 10 labeled "current" is said to be 90° out of phase with the waveform labeled "voltage," since the waves reach similar points in their cycles exactly 1/4 of a cycle apart (360°/4 = 90°). Phase shifts are common in electronics.

Figure 10: Phase shift.
Waveform Measurements with Digital Oscilloscopes
Digital oscilloscopes have functions that make waveform measurements easy. They have front-panel buttons and screen-based menus from which you can select fully-automated measurements. These include amplitude, period, rise/fall time, and many more.
Many digital oscilloscopes also provide mean and RMS calculations, duty cycle, and other math operations. Automated measurements appear as on-screen alphanumeric readouts. Typically these readings are more accurate than is possible to obtain with direct graticule interpretation.

Oscilloscope Types Explained: Analog vs. Digital Functionality
Electronic equipment can be classified into two categories: analog and digital. Analog equipment works with continuously variable voltages, while digital equipment works with discrete binary numbers that represent voltage samples. A conventional phonograph is an analog device, while a CD player is a digital device. Oscilloscopes can be classified similarly – as analog and digital types. In contrast to an analog oscilloscope, a digital oscilloscope uses an analog-to-digital converter (ADC) to convert the measured voltage into digital information. It acquires the waveform as a series of samples, and stores these samples until it accumulates enough samples to describe a waveform. The digital oscilloscope then reassembles the waveform for display on the screen, as shown in Figure 11.
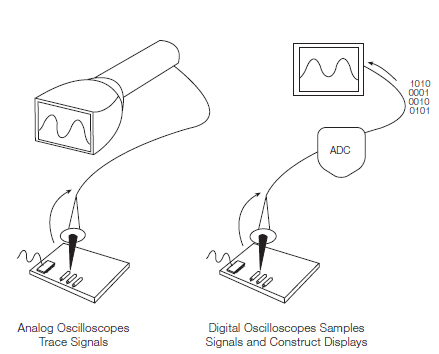
Figure 11: Analog oscilloscopes trace signals, while digital oscilloscopes sample signals and construct displays.
Types of Digital Oscilloscopes
Digital oscilloscopes can be classified into four types:
- Digital storage oscilloscopes (DSO)
- Digital phosphor oscilloscopes (DPO)
- Mixed signal oscilloscopes (MSO)
- Digital sampling oscilloscopes
This chapter describes these types of digital oscilloscopes in detail to help you zero in on the type of oscilloscope that’s right for your needs.
Digital Storage Oscilloscopes (DSO)
A conventional digital oscilloscope is known as a digital storage oscilloscope (DSO). Its display typically relies on a raster-type screen rather than the luminous phosphor found in older analog oscilloscopes.
DSOs allow you to capture and view events that may happen only once, known as transients. Because the waveform information exists in digital form as a series of stored binary values, it can be analyzed, archived, printed, and otherwise processed, within the oscilloscope itself or by an external computer.
The waveform need not be continuous; it can be displayed even when the signal disappears. Unlike analog oscilloscopes, DSOs provide permanent signal storage and extensive waveform processing. However, DSOs typically have no real-time intensity grading. Therefore they cannot express varying levels of intensity in the live signal.
Some of the subsystems in DSOs are similar to those in analog oscilloscopes. However, DSOs contain additional data-processing subsystems that are used to collect and display data for the entire waveform. A DSO employs a serial-processing architecture to capture and display a signal on its screen, as shown in Figure 12.
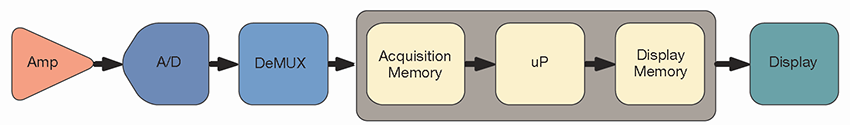
Figure 12: The serial-processing architecture of a digital storage oscilloscope (DSO).
Serial-processing Architecture
Like an analog oscilloscope, a DSO’s first (input) stage is a vertical amplifier. Vertical controls allow you to adjust the amplitude and position range at this stage. Next, the analog to digital converter (ADC) in the horizontal system samples the signal at discrete points in time and converts the signal’s voltage at these points into digital values called sample points. This process is referred to as digitizing a signal.
The horizontal system’s sample clock determines how often the ADC takes a sample. This rate is referred to as the sample rate and is expressed in samples per second (S/s).
The sample points from the ADC are stored in acquisition memory as waveform points. Several sample points may comprise one waveform point. Together, the waveform points comprise one waveform record. The number of waveform points used to create a waveform record is called the record length. The trigger system determines the start and stop points of the record.
The DSO’s signal path includes a microprocessor through which the measured signal passes on its way to the display. This microprocessor processes the signal, coordinates display activities, manages the front panel controls, and more. The signal then passes through the display memory and is displayed on the oscilloscope screen.
Depending on the capabilities of an oscilloscope, additional processing of the sample points may take place, which enhances the display. Pre-trigger may also be available so you can see events before the trigger point. Most digital oscilloscopes also provide a selection of automatic parametric measurements, simplifying the measurement process.
DSOs provide high performance in a single-shot, multi-channel instrument (Figure 13). They are ideal for low repetition-rate or single-shot, high-speed, multichannel design applications. In the real world of digital design, an engineer usually examines four or more signals simultaneously, making the DSO a critical companion.

Figure 13: The digital storage oscilloscope delivers high-speed, single-shot acquisition across multiple channels, increasing the likelihood of capturing elusive glitches and transient events
Digital Phosphor Oscilloscopes (DPO)
The digital phosphor oscilloscope (DPO) offers a new approach to oscilloscope architecture. This architecture enables it to deliver unique acquisition and display capabilities to accurately reconstruct a signal. While a DSO uses a serial-processing architecture to capture, display, and analyze signals, a DPO employs a parallel processing architecture to perform these functions (Figure 14).
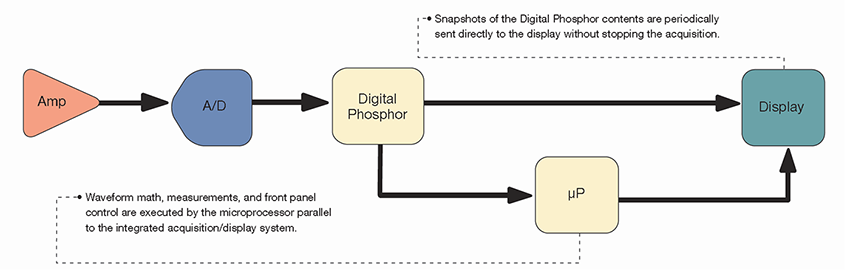
Figure 14: The parallel-processing architecture of a digital phosphor oscilloscope (DPO).
The DPO architecture dedicates unique ASIC hardware to acquire waveform images, delivering high waveform capture rates, resulting in a higher level of signal visualization. This performance increases the probability of witnessing transient events that occur in digital systems, such as runt pulses, glitches and transition errors, and enables additional analysis capability.
Parallel-processing Architecture
A DPO’s first (input) stage is similar to that of an analog oscilloscope—a vertical amplifier—and its second stage is similar to that of a DSO—an ADC. But, the DPO differs significantly from its predecessors following the analog-to-digital conversion.
For any oscilloscope—analog, DSO, or DPO—there is always a hold-off time during which the instrument processes the most recently acquired data, resets the system, and waits for the next trigger event. During this time, the oscilloscope is blind to all signal activity. The probability of seeing an infrequent or low repetition event decreases as the hold off time increases.
It is impossible to determine the probability of capture by simply looking at the display update rate. If you rely solely on the update rate, it is easy to make the mistake of believing that the oscilloscope is capturing all pertinent information about the waveform when, in fact, it is not.
The DSO processes captured waveforms serially. The speed of its microprocessor is a bottleneck in this process because it limits the waveform capture rate. The DPO rasterizes the digitized waveform data into a digital phosphor database. Every 1/30th of a second—about as fast as the human eye can perceive it—a snapshot of the signal image that is stored in the database is pipelined directly to the display. This direct rasterization of waveform data, and direct copy to display memory from the database, removes the data-processing bottleneck inherent in other architectures. The result is an enhanced “real-time” and lively display update. Signal details, intermittent events, and dynamic characteristics of the signal are captured in real-time. The DPO’s microprocessor works in parallel with this integrated acquisition system for display management, measurement automation, and instrument control, so that it does not affect the oscilloscope’s acquisition speed.
A DPO faithfully emulates the best display attributes of an analog oscilloscope, displaying the signal in three dimensions: time, amplitude, and the distribution of amplitude over time. All in real-time.
Unlike an analog oscilloscope’s reliance on chemical phosphor, a DPO uses a purely electronic digital phosphor that’s actually a continuously updated database. This database has a separate “cell” of information for every single pixel in the oscilloscope’s display. Each time a waveform is captured—in other words, every time the oscilloscope triggers—it is mapped into the digital phosphor database’s cells. Each cell that represents a screen location and is touched by the waveform is reinforced with intensity information, while other cells are not. Thus, intensity information builds up in cells where the waveform passes most often.
When the digital phosphor database is fed to the oscilloscope’s display, the display reveals intensified waveform areas, in proportion to the signal’s frequency of occurrence at each point, much like the intensity grading characteristics of an analog oscilloscope. The DPO also allows the display of the varying frequency-of-occurrence information on the display as contrasting colors, unlike an analog oscilloscope. With a DPO, it is easy to see the difference between a waveform that occurs on almost every trigger and one that occurs, say, every 100th trigger.
A DPO break down the barrier between analog and digital oscilloscope technologies. They are equally suitable for viewing high and low frequencies, repetitive waveforms, transients, and signal variations in real-time. Only a DPO provides the Z-axis (intensity) in real-time that is missing from conventional DSOs.
A DPO is ideal for those who need the best general purpose design and troubleshooting tool for a wide range of applications (Figure 15). A DPO is exemplary for advanced analysis, communication mask testing, digital debug of intermittent signals, repetitive digital design. and timing applications.
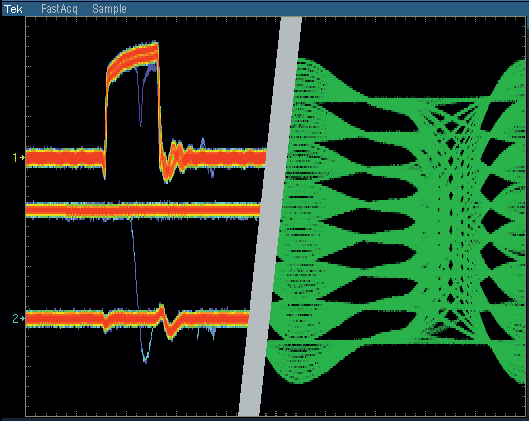
Figure 15: Some DPOs can acquire millions of waveform in just seconds, significantly increasing the probability of capturing intermittent and elusive events and revealing dynamic signal behavior.
Mixed Domain Oscilloscopes (MDO)
Electronic equipment can be classified into two categories: analog and digital. Analog equipment works with continuously variable voltages, while digital equipment works with discrete binary numbers that represent voltage samples. A phonograph is an analog device, while an MP3 player is a digital device.

Figure 16: Time-correlated display of a Zigbee radio's microprocessor SPI (MOSI) and (MISO) control lines, with measurements of drain current and voltage to the radio IC and the spectrum during turn-on.
Mixed Signal Oscilloscopes (MSO)
The mixed signal oscilloscope (MSO) combines the performance of a DPO with the basic functionality of a 16-channel logic analyzer, including parallel/serial bus protocol decoding and triggering.
The MSO's digital channels view a digital signal as either a logic high or logic low, just like a digital circuit views the signal. This means as long as ringing, overshoot and ground bounce do not cause logic transitions, these analog characteristics are not of concern to the MSO. Just like a logic analyzer, a MSO uses a threshold voltage to determine if the signal is logic high or logic low.
The MSO is the tool of choice for quickly debugging digital circuits using its powerful digital triggering, high-resolution acquisition capability, and analysis tools. The root cause of many digital problems is quicker to pinpoint by analyzing both the analog and digital representations of the signal, as shown in Figure 17, making an MSO ideal for verifying and debugging digital circuits.

Figure 17: The MSO provides 16 integrated digital channels, enabling the ability to view and analyze time-correlated analog and digital signals.
Digital Sampling Oscilloscopes
In contrast to the digital storage and DPO architectures, the architecture of the digital sampling oscilloscope reverses the position of the attenuator/ amplifier and the sampling bridge (Figure 18). The input signal is sampled before any attenuation or amplification is performed. A low bandwidth amplifier can then be used after the sampling bridge because the signal has already been converted to a lower frequency by the sampling gate, resulting in a much higher bandwidth instrument.
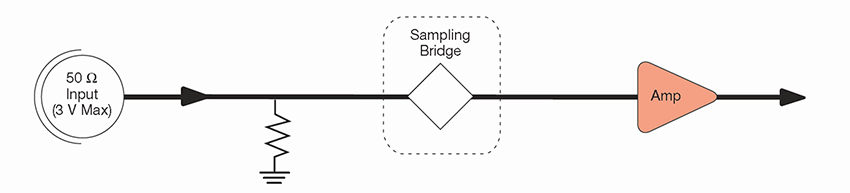
Figure 18: The parallel-processing architecture of a digital phosphor oscilloscope (DPO).
The tradeoff for this high bandwidth, however, is that the sampling oscilloscope’s dynamic range is limited. Since there is no attenuator/amplifier in front of the sampling gate, there is no facility to scale the input. The sampling bridge must be able to handle the full dynamic range of the input at all times. Therefore, the dynamic range of most sampling oscilloscopes is limited to about 1 V peak-to-peak. Digital storage and DPOs, on the other hand, can handle 50 to 100 volts.
In addition, protection diodes cannot be placed in front of the sampling bridge, as this limits the bandwidth. This reduces the safe input voltage for a sampling oscilloscope to about 3 V, as compared to 500 V available on other oscilloscopes.
When measuring high-frequency signals, the DSO or DPO may not be able to collect enough samples in one sweep. A digital sampling oscilloscope is an ideal tool for accurately capturing signals whose frequency components are much higher than the oscilloscope’s sample rate (Figure 19). This oscilloscope is capable of measuring signals of up to an order of magnitude faster than any other oscilloscope. It can achieve bandwidth and high-speed timing ten times higher than other oscilloscopes for repetitive signals. Sequential equivalent-time sampling oscilloscopes are available with bandwidths to 80 GHz.

Figure 19: Time domain reflectometry (TDR) display from a digital sampling oscilloscope.
Evaluating Oscilloscopes: Learn About Key Features & Functions
Once you've determined the type of oscilloscope you need, there are still many models to choose from, including portable and hand-held. And when choosing an oscilloscope, there are a number of things to consider, such as the ease-of use, sample rate the probes used to bring data into it, and all the elements of an oscilloscope that affect its ability to achieve the required signal integrity.
To understand these considerations, we'll look briefly at ease-of-use and probes, and then describe some useful measurement and oscilloscope performance terms. These terms cover the criteria essential to choosing the right oscilloscope for your application.
Ease-of-Use
Oscilloscopes should be easy to learn and easy to use, helping you work at peak efficiency and productivity. This means you can focus on your design, rather than the measurement tools. Just as there is no one typical car driver, there is no one typical oscilloscope user. Regardless of whether you prefer a traditional instrument interface or a Windows® software interface, it is important to have flexibility in your oscilloscope's operation. Many oscilloscopes offer a balance between performance and simplicity by providing many ways to operate the instrument. A typical oscilloscope's front-panel layout (Figure 60) provides dedicated vertical, horizontal and trigger controls.

Figure 60: Traditional, analog-style knobs control position, scale, intensity, etc. – precisely as you would expect.
The Complete Measurement System Probes
Even the most advanced instrument can only be as precise as the data that goes into it. A probe works in conjunction with an oscilloscope as part of the measurement system. Precision measurements start at the probe tip. The right probes matched to the oscilloscope and the device under test (DUT) not only allow the signal to be brought to the oscilloscope cleanly, they also amplify and preserve the signal for the greatest signal integrity and measurement accuracy. Please refer to the Tektronix ABCs of Probes Primer for more information about probes and probe accessories.
Bandwidth
Bandwidth determines an oscilloscope's fundamental ability to measure a signal. As signal frequency increases, the capability of an oscilloscope to accurately display the signal decreases. The bandwidth specification indicates the frequency range that the oscilloscope can accurately measure.
Oscilloscope bandwidth is specified as the frequency at which a sinusoidal input signal is attenuated to 70.7% of the signal's true amplitude, known as the –3 dB point, a term based on a logarithmic scale, as shown in Figure 44.
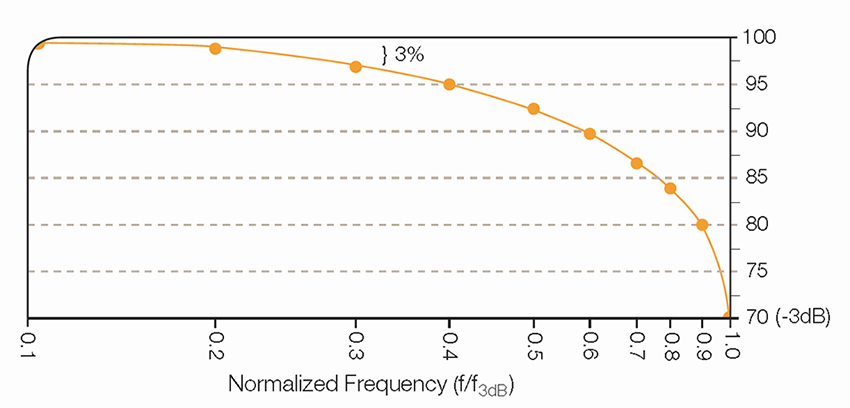
Figure 44: Oscilloscope bandwidth is the frequency at which a sinusoidal input signal is attenuated to 70.7% of the signal's true amplitude, known as the -3 dB point.
Without adequate bandwidth, an oscilloscope cannot resolve high-frequency changes. Amplitude is distorted. Edges vanish. Details are lost. All the features, bells and whistles in your oscilloscope will mean nothing.
To determine the oscilloscope bandwidth needed to accurately characterize signal amplitude in your specific application, apply the “5 Times Rule”:
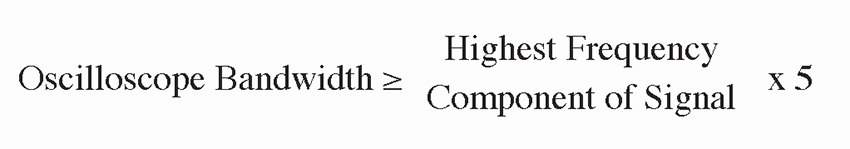
5 Times Rule
An oscilloscope selected using the “5 Times Rule” provides less than ±2% error in your measurements. This is typically sufficient for today's applications. However, as signal speeds increase, it may not be possible to achieve this rule of thumb. Keep in mind that higher bandwidth will likely provide more accurate reproduction of a signal, as shown in Figure 45.

Figure 45: The higher the bandwidth, the more accurate the reproduction of your signal, as illustrated with a signal captured at 250 MHz, 1 GHz and 4 GHz bandwidth levels.
Some oscilloscopes provide a method of enhancing the bandwidth through digital signal processing (DSP). A DSP arbitrary equalization filter can be used to improve the oscilloscope channel response. This filter extends the bandwidth, flattens the oscilloscope's channel frequency response, improves phase linearity, and provides a better match between channels. It also decreases rise time and improves the time domain step response.
Rise Time
Rise time describes the useful frequency range of an oscilloscope. Rise time measurements are critical in the digital world. Rise time may be a more appropriate performance consideration when you expect to measure digital signals, such as pulses and steps. An oscilloscope must have sufficient rise time to accurately capture the details of rapid transitions (Figure 46).

Figure 46: Rise time characterization of a high-speed digital signal.
To calculate the oscilloscope rise time required for your signal type, use this equation:

Oscilloscope Rise Time
Using this equation is similar to using the equation for bandwidth. As in the case of bandwidth, achieving this rule of thumb may not always be possible given the extreme speeds of today's signals. Always remember that an oscilloscope with faster rise time will more accurately capture the critical details of fast transitions.
In some applications, you may know only the rise time of a signal. A constant allows you to relate the bandwidth and rise time of the oscilloscope using this equation:

Bandwidth and Rise Time
Where K is a value between 0.35 and 0.45, depending on the shape of the oscilloscope's frequency response curve and pulse rise time response. Oscilloscopes with a bandwidth of <1 GHz typically have a 0.35 value, while oscilloscopes with a bandwidth of> 1 GHz usually have a value between 0.40 and 0.45.
Some logic families produce inherently faster rise times than others (Figure 47).

Figure 47: Some logic families produce inherently faster rise times than others.
Sample Rate
Sample rate is specified in samples per second (S/s). It defines how frequently a digital oscilloscope takes a snapshot or sample of the signal, analogous to the frames in a movie. The faster an oscilloscope samples (i.e., the higher the sample rate), the greater the resolution and detail of the displayed waveform and the less likely that critical information or events is lost (Figure 48).

Figure 48: A higher sample rate provides greater signal resolution, ensuring that you'll see intermittent events.
The minimum sample rate may also be important if you need to look at slowly changing signals over longer periods of time. Typically, the displayed sample rate changes with changes made to the horizontal scale control to maintain a constant number of waveform points in the displayed waveform record.
How do you calculate your sample rate requirements? The method differs based on the type of waveform you are measuring, and the method of signal reconstruction used by the oscilloscope.
In order to accurately reconstruct a signal and avoid aliasing, the Nyquist theorem states that the signal must be sampled at least twice as fast as its highest frequency component. This theorem, however, assumes an infinite record length and a continuous signal. Since no oscilloscope offers infinite record length and, by definition, glitches are not continuous, sampling at only twice the rate of highest frequency component is usually insufficient.
In reality, accurate reconstruction of a signal depends on both the sample rate and the interpolation method used to fill in the spaces between the samples. Some oscilloscopes let you select either sin (x)/x interpolation for measuring sinusoidal signals, or linear interpolation for square waves, pulses and other signal types.
For accurate reconstruction using sin (x)/x interpolation, your oscilloscope should have a sample rate at least 2.5 times the highest frequency component of your signal. Using linear interpolation, the sample rate should be at least 10 times the highest frequency signal component.
Some measurement systems with sample rates to 10 GS/s and bandwidths to 3+ GHz are optimized for capturing very fast, single-shot and transient events by oversampling up to 5 times the bandwidth.
A Note About Bandwidth and Sample Rate
The digital approach means that the oscilloscope can display any frequency within its range with stability, brightness, and clarity. For repetitive signals, the bandwidth of the digital oscilloscope is a function of the analog bandwidth of the front-end components of the oscilloscope, commonly referred to as the –3 dB point. For single-shot and transient events, such as pulses and steps, the bandwidth can be limited by the oscilloscope's sample rate.
Waveform Capture Rate
All oscilloscopes blink. That is, they open their eyes a given number of times per second to capture the signal, and close their eyes in between. This is the waveform capture rate, expressed as waveforms per second (wfms/s). While the sample rate indicates how frequently the oscilloscope samples the input signal within one waveform, or cycle, the waveform capture rate refers to how quickly an oscilloscope acquires waveforms.
Waveform capture rates vary greatly, depending on the type and performance level of the oscilloscope. Oscilloscopes with high waveform capture rates provide significantly more visual insight into signal behavior, and dramatically increase the probability that the oscilloscope will quickly capture transient anomalies such as jitter, runt pulses, glitches and transition errors.
Digital storage oscilloscopes (DSO) employ a serial processing architecture to capture from 10 to 5,000 wfms/s. Some DSOs provide a special mode that bursts multiple captures into long memory, temporarily delivering higher waveform capture rates followed by long processing dead times that reduce the probability of capturing rare, intermittent events.
Most digital phosphor oscilloscopes (DPO) employ a parallel processing architecture to deliver vastly greater waveform capture rates. Some DPOs can acquire millions of waveforms in just seconds, significantly increasing the probability of capturing intermittent and elusive events and allowing you to see the problems in your signal more quickly (Figure 49).

Figure 49: A DPO provides an ideal solution for non-repetitive, high-speed, multi-channel digital design applications.
Moreover, the DPO's ability to acquire and display three dimensions of signal behavior in real time—amplitude, time and distribution of amplitude over time—results in a superior level of insight into signal behavior (Figure 50).

Figure 50: A DPO enables a superior level of insight into signal behavior by
- delivering vastly greater waveform capture rates and three-dimensional
- display, making it the best general-purpose design and troubleshooting
- tool for a wide range of applications.
- delivering vastly greater waveform capture rates and three-dimensional
- display, making it the best general-purpose design and troubleshooting
- tool for a wide range of applications.
Record Length
Record length, expressed as the number of points that comprise a complete waveform record, determines the amount of data that can be captured with each channel. Since an oscilloscope can store only a limited number of samples, the waveform duration (time) is inversely proportional to the oscilloscope's sample rate:

Time Interval
Oscilloscopes allow you to select record length to optimize the level of detail needed for your application. If you are analyzing an extremely stable sinusoidal signal, you may need only a 500 point record length, but if you are isolating the causes of timing anomalies in a complex digital data stream, you may need a million points or more for a given record length, as shown in Figure 51.

Figure 51: Capturing the high frequency detail of this modulated 85 MHz carrier requires high resolution sampling (100 ps). Seeing the signal's complete modulation envelope requires a long time duration (1 ms). Using long record length (10 MB), the oscilloscope can display both.
Triggering Capabilities
An oscilloscope's trigger function synchronizes the horizontal sweep at the correct point of the signal. This is essential for clear signal characterization. Trigger controls allow you to stabilize repetitive waveforms and capture single-shot waveforms.
Effective Bits
Effective bits represent a measure of a digital oscilloscope's ability to accurately reconstruct a sine wave signal's shape. This measurement compares the oscilloscope's actual error to that of a theoretical “ideal” digitizer. Because the actual errors include noise and distortion, the frequency and amplitude of the signal must be specified.
Frequency Response
Bandwidth alone is not enough to ensure that an oscilloscope can accurately capture a high frequency signal. The goal of oscilloscope design is a specific type of frequency response: maximally flat envelope delay (MFED). A frequency response of this type delivers excellent pulse fidelity with minimum overshoot and ringing. Since a digital oscilloscope is composed of real amplifiers, attenuators, ADCs, interconnects, and relays, MFED response is a goal that can only be approached. Pulse fidelity varies considerably with model and manufacturer.
Vertical Sensitivity
Vertical sensitivity indicates how much the vertical amplifier can amplify a weak signal. This is usually measured in millivolts (mV) per division. The smallest voltage detected by a general-purpose oscilloscope is typically about 1 mV per vertical screen division.
Sweep Speed
Sweep speed indicates how fast the trace can sweep across the oscilloscope screen, making it possible to see fine details. The sweep speed of an oscilloscope is represented by time (seconds) per division.
Gain Accuracy
Gain accuracy indicates how accurately the vertical system attenuates or amplifies a signal, usually represented as a percentage error.
Horizontal Accuracy (Time Base)
Horizontal accuracy, or time base accuracy, indicates how accurately the horizontal system displays the timing of a signal, usually represented as a percentage error.
Vertical Resolution (Analog-to-Digital Converter)
Vertical resolution of the analog-to-digital converter (ADC), and therefore, the digital oscilloscope, indicates how precisely it can convert input voltages into digital values. Vertical resolution is measured in bits. Calculation techniques can improve the effective resolution, as exemplified with hi-res acquisition mode.
Timing Resolution Mixed Signal Oscilloscopes (MSO)
An important MSO acquisition specification is the timing resolution used for capturing digital signals. Acquiring a signal with better timing resolution provides a more accurate timing measurement of when the signal changes. For example, a 500 MS/s acquisition rate has 2 ns timing resolution and the acquired signal edge uncertainty is 2 ns. A smaller timing resolution of 60.6 ps (16.5 GS/s) decreases the signal edge uncertainty to 60.6 ps and captures faster changing signals.
Some MSOs internally acquire digital signals with two types of acquisitions at the same time. The first acquisition is with standard timing resolution, and the second acquisition uses a high-speed resolution. The standard resolution is used over a longer record length while the high-speed timing acquisition offers more resolution around a narrow point of interest (Figure 52).

Figure 52: The MSO provides 16 integrated digital channels, enabling the ability to view and analyze time-correlated analog and digital signals. A high speed timing acquisition provides more resolution to reveal narrow events such as glitches.
Connectivity
The need to analyze measurement results remains of utmost importance. The need to document and share information and measurement results easily and frequently has also grown in importance. The connectivity of an oscilloscope delivers advanced analysis capabilities and simplifies the documentation and sharing of results. As shown in Figure 53, standard interfaces (GPIB, RS-232, USB, and Ethernet) and network communication modules enable some oscilloscopes to deliver a vast array of functionality and control.

Figure 53: Today's oscilloscopes provide a wide array of communications interfaces, such as a standard Centronics port and optional Ethernet/RS-232, GPIB/RS-232, and VGA/RS-232 modules. There is even a USB port (not shown) on the front panel.
Some advanced oscilloscopes also let you:
- Create, edit and share documents on the oscilloscope, all while working with the instrument in your particular environment
- Access network printing and file sharing resources
- Access the Windows® desktop
- Run third-party analysis and documentation software
- Link to networks
- Access the Internet
- Send and receive e-mail
Expandability
An oscilloscope should be able to accommodate your needs as they change. Some oscilloscopes allow you to:
- Add memory to channels to analyze longer record lengths
- Add application-specific measurement capabilities
- Complement the power of the oscilloscope with a full range of probes and modules
- Work with popular third-party analysis and productivity
- Windows-compatible software
- Add accessories, such as battery packs and rack mounts
Application modules and software may enable you to transform your oscilloscope into a highly-specialized analysis tool capable of performing functions such as jitter and timing analysis, microprocessor memory system verification, communications standards testing, disk drive measurements, video measurements, power measurements and much more. Figures 54 through 59 highlight a few of these examples.

Figure 54: Analysis software packages are specifically designed to meet jitter and eye measurement needs of today's high-speed digital designers.

Figure 55: Serial bus analysis is accelerated with automated trigger, decode, and search on serial packet context.

Figure 57: Advanced DDR analysis tools automate complex memory tasks like separating read/write bursts and performing JEDEC measurements.

Figure 58: Video application modules make the oscilloscope a fast, tell-all tool for video troubleshooting.

Figure 59: Advanced analysis and productivity software, such as MATLAB®, can be installed in Windows-based oscilloscopes to accomplish local signal analysis.
Oscilloscope Systems and Controls: Vertical, Horizontal & Triggering Explained
Analog and digital oscilloscopes have some basic controls that are similar, and some that are different. We’ll look at the basic systems and controls that are common to both. Understanding these systems and controls is key to using an oscilloscope to tackle your specific measurement challenges. Note that your oscilloscope probably has additional controls not discussed here.
The Three Systems
A basic oscilloscope consists of three different systems – the vertical system, horizontal system, and trigger system. Each system contributes to the oscilloscope’s ability to accurately reconstruct a signal.
The front panel of an oscilloscope is divided into three sections labeled Vertical, Horizontal, and Trigger. Your oscilloscope may have other sections, depending on the model and type.
When using an oscilloscope, you adjust settings in these areas to accommodate an incoming signal:
- Vertical: This is the attenuation or amplification of the signal. Use the volts/div control to adjust the amplitude of the signal to the desired measurement range.
- Horizontal: This is the time base. Use the sec/div control to set the amount of time per division represented horizontally across the screen.
- Trigger: This is the triggering of the oscilloscope. Use the trigger level to stabilize a repeating signal, or to trigger on a single event.
We’ll look at each of these systems and controls, in this chapter.
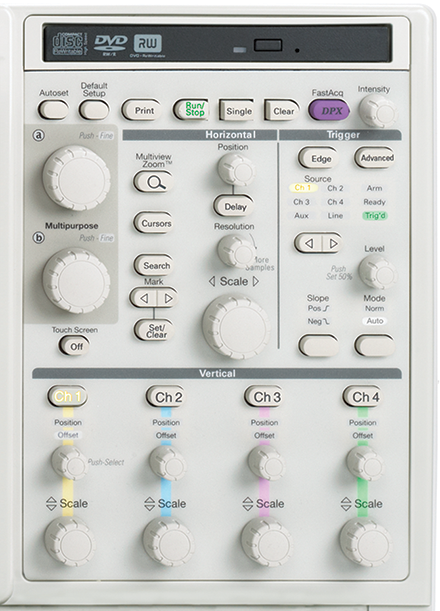
Figure 20: Front-panel control section of an oscilloscope.
Vertical System and Controls
Vertical controls are used to position and scale the waveform vertically, set the input coupling, and adjust other signal conditioning. Common vertical controls include:
- Position
- Coupling: DC, AC, and GND
- Bandwidth: Limit and Enhancement
- Termination: 1M ohm and 50 ohm
- Offset
- Invert: On/Off
- Scale: Fixed Steps and Variable
Some of these controls are described next.
Position and Volts per Division
The vertical position control allows you to move the waveform up and down so it’s exactly where you want it on the screen.
The volts-per-division setting (usually written as volts/div) is a scaling factor that varies the size of the waveform on the screen. If the volts/div setting is 5 volts, then each of the eight vertical divisions represents 5 volts and the entire screen can display 40 volts from bottom to top, assuming a graticule with eight major divisions. If the setting is 0.5 volts/div, the screen can display 4 volts from bottom to top, and so on.
The maximum voltage you can display on the screen is the volts/div setting multiplied by the number of vertical divisions. Note that the probe you use, 1X or 10X, also influences the scale factor.
You must divide the volts/div scale by the attenuation factor of the probe if the oscilloscope does not do it for you. Often the volts/div scale has either a variable gain or a fine gain control for scaling a displayed signal to a certain number of divisions. Use this control to assist in taking rise time measurements.
Input Coupling
Coupling refers to the method used to connect an electrical signal from one circuit to another. In this case, the input coupling is the connection from your test circuit to the oscilloscope.
The coupling can be set to DC, AC, or ground. DC coupling shows all of an input signal. AC coupling blocks the DC component of a signal so that you see the waveform centered around zero volts. Figure 21 illustrates this difference.
The AC coupling setting is useful when the entire signal (alternating current + direct current) is too large for the volts/div setting.
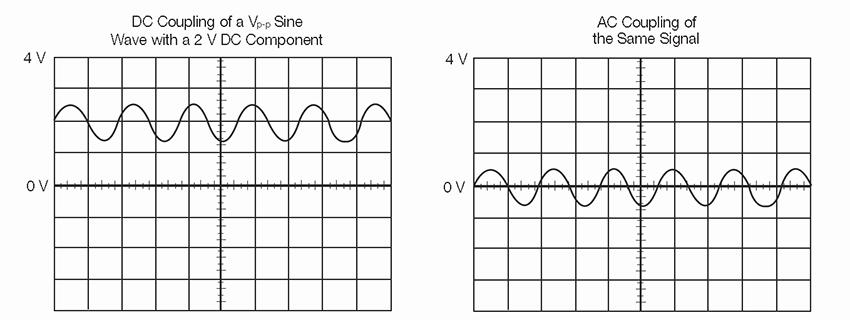
Figure 21: AC and DC input coupling.
The ground setting disconnects the input signal from the vertical system, which lets you see where zero volts is located on the screen.
With grounded input coupling and auto trigger mode, you see a horizontal line on the screen that represents zero volts. Switching from DC to ground and back again is a handy way of measuring signal voltage levels with respect to ground.
Bandwidth Limit
Most oscilloscopes have a circuit that limits the bandwidth of the oscilloscope. By limiting the bandwidth, you reduce the noise that sometimes appears on the displayed waveform, resulting in a cleaner signal display.
Note that while eliminating noise, the bandwidth limit can also reduce or eliminate high frequency signal content.
Bandwidth Enhancement
Some oscilloscopes may provide a DSP arbitrary equalization filter that can be used to improve the oscilloscope channel response. This filter extends the bandwidth, flattens the oscilloscope channel frequency response, improves phase linearity, and provides a better match between channels. It also decreases rise time and improves the time domain step response.
Horizontal System and Controls
An oscilloscope’s horizontal system is most closely associated with its acquisition of an input signal. Sample rate and record length are among the considerations here. Horizontal controls are used to position and scale the waveform horizontally. Common horizontal controls include:
- Acquisition
- Sample Rate
- Position and Seconds per Division
- Time Base
- Zoom/Pan
- Search
- XY Mode
- Z Axis
- XYZ Mode
- Trigger Position
- Scale
- Trace Separation
- Record Length
- Resolution
Some of these controls are described next.
Acquisition Controls
Digital oscilloscopes have settings that let you control how the acquisition system processes a signal. Figure 22 shows an example of an acquisition menu.
Look over the acquisition options on your digital oscilloscope while you read this section.

Figure 22: Example of an acquisition menu.
Acquisition Modes
Acquisition modes control how waveform points are produced from sample points. Sample points are the digital values derived directly from the analog-to-digital converter (ADC). The sample interval refers to the time between these sample points.
Waveform points are the digital values that are stored in memory and displayed to construct the waveform. The time-value difference between waveform points is referred to as the waveform interval.
The sample interval and the waveform interval may or may not be the same. This fact leads to the existence of several different acquisition modes in which one waveform point is comprised of several sequentially acquired sample points.
Additionally, waveform points can be created from a composite of sample points taken from multiple acquisitions, which provides another set of acquisition modes. A description of the most commonly used acquisition modes follows.
Sample Mode: This is the simplest acquisition mode. The oscilloscope creates a waveform point by saving one sample point during each waveform interval.
Peak Detect Mode: The oscilloscope saves the minimum and maximum value sample points taken during two waveform intervals and uses these samples as the two corresponding waveform points.
Digital oscilloscopes with peak detect mode run the ADC at a fast sample rate, even at very slow time base settings (slow time base settings translate into long waveform intervals) and are able to capture fast signal changes that would occur between the waveform points if in sample mode (Figure 23).

Figure 23: Sample rate varies with time base settings - the slower the time based setting, the slower the sample rate. Some digital oscilloscopes provide peak detect mode to capture fast transients at slow sweep speeds.
Peak detect mode is particularly useful for seeing narrow pulses spaced far apart in time, as shown in Figure 24.

Figure 24: Advanced analysis and productivity software, such as MATLAB®, can be installed in Windows-based oscilloscopes to accomplish local signal analysis.
Hi-Res Mode: Like peak detect, hi-res mode is a way of getting more information in cases when the ADC can sample faster than the time base setting requires. In this case, multiple samples taken within one waveform interval are averaged together to produce one waveform point.
The result is a decrease in noise and an improvement in resolution for low-speed signals. The advantage of Hi-Res Mode over Average is that Hi-Res Mode can be used even on a single shot event.
Envelope Mode: Envelope mode is similar to peak detect mode. However, in envelope mode, the minimum and maximum waveform points from multiple acquisitions are combined to form a waveform that shows min/max accumulation over time.
Peak detect mode is usually used to acquire the records that are combined to form the envelope waveform.
Average Mode: In average mode, the oscilloscope saves one sample point during each waveform interval as in sample mode. However, waveform points from consecutive acquisitions are then averaged together to produce the final displayed waveform.
Average mode reduces noise without loss of bandwidth, but requires a repeating signal.
Waveform Database Mode: In waveform database mode, the oscilloscope accumulates a waveform database that provides a three-dimensional array of amplitude, time, and counts.
Starting and Stopping the Acquisition System
One of the greatest advantages of digital oscilloscopes is their ability to store waveforms for later viewing.
To this end, there are usually one or more buttons on the front panel that allow you to start and stop the acquisition system so you can analyze waveforms at your leisure.
Additionally, you may want the oscilloscope to automatically stop acquiring after one acquisition is complete or after one set of records has been turned into an envelope or average waveform.
This feature is commonly called single sweep or single sequence and its controls are usually found either with the other acquisition controls or with the trigger controls.
Sampling
Sampling is the process of converting a portion of an input signal into a number of discrete electrical values for the purpose of storage, processing, and/or display. The magnitude of each sampled point is equal to the amplitude of the input signal at the instant in time in which the signal is sampled.
Sampling is like taking snapshots. Each snapshot corresponds to a specific point in time on the waveform. These snapshots can then be arranged in the appropriate order in time to reconstruct the input signal.
In a digital oscilloscope, an array of sampled points is reconstructed on a display with the measured amplitude on the vertical axis and time on the horizontal axis (Figure 25).
The input waveform in Figure 25 appears as a series of dots on the screen. If the dots are widely spaced and difficult to interpret as a waveform, the dots can be connected using a process called interpolation.
Interpolation connects the dots with lines or vectors. A number of interpolation methods are available that can be used to produce an accurate representation of a continuous input signal.

Figure 25: Basic sampling, showing sample points are connected by interpolation to produce a continuous waveform.
Sampling Controls
Some digital oscilloscopes provide you with a choice in sampling method, either real-time sampling or equivalent time sampling. The acquisition controls available with these oscilloscopes allow you to select a sample method to acquire signals.
Note that this choice makes no difference for slow time base settings and only has an effect when the ADC cannot sample fast enough to fill the record with waveform points in one pass. Each sampling method has distinct advantages, depending on the kind of measurements being made.
Controls are typically available to give you the choice of three horizontal time base modes of operations. If you are simply doing signal exploration and want to interact with a lively signal, you use the Automatic or Interactive Default mode that provides you with the liveliest display update rate.
If you want a precise measurement and the highest real-time sample rate that will give you the most measurement accuracy, then you use the Constant Sample Rate mode. It maintains the highest sample rate and provides the best real-time resolution.
The last mode is called the Manual mode because it ensures direct and independent control of the sample rate and record length.
Real-time Sampling Method
Real-time sampling is ideal for signals whose frequency range is less than half the oscilloscope’s maximum sample rate.
Here, the oscilloscope can acquire more than enough points in one “sweep” of the waveform to construct an accurate picture, as shown in Figure 26. Real-time sampling is the only way to capture fast, single-shot, transient signals with a digital oscilloscope.

Figure 26: Advanced analysis and productivity software, such as MATLAB®, can be installed in Windows-based oscilloscopes to accomplish local signal analysis.
Real-time sampling presents the greatest challenge for digital oscilloscopes because of the sample rate needed to accurately digitize high-frequency transient events, as shown in Figure 27.
These events occur only once, and must be sampled in the same time frame that they occur.

Figure 27: Real-time sampling method.
If the sample rate isn’t fast enough, high-frequency components can “fold down” into a lower frequency, causing aliasing in the display, as demonstrated in Figure 28. In addition, real-time sampling is further complicated by the high-speed memory required to store the waveform once it is digitized.
Please refer to the Sample Rate and Record Length sections in Chapter 3—Evaluating Oscilloscopes for additional detail about the sample rate and record length needed to accurately characterize high-frequency components.

Figure 28: Undersampling of a 100 MHz sine wave introduces aliasing effects.
For real-time sampling with interpolation, digital oscilloscopes take discrete samples of the signal that can be displayed. However, it can be difficult to visualize the signal represented as dots, especially because there can be only a few dots representing high-frequency portions of the signal.
To aid in the visualization of signals, digital oscilloscopes typically have interpolation display modes.
Interpolation is a processing technique used to estimate what the waveform looks like based on a few points. In simple terms, interpolation “connects the dots” so that a signal that is sampled only a few times in each cycle can be accurately displayed.
Using real-time sampling with interpolation, the oscilloscope collects a few sample points of the signal in a single pass in real-time mode and uses interpolation to fill in the gaps. Linear interpolation connects sample points with straight lines. This approach is limited to reconstructing straight- edged signals (Figure 29), which better lends itself to square waves. The more versatile sin x/x interpolation connects sample points with curves (Figure 29).
Sin x/x interpolation is a mathematical process in which points are calculated to fill in the time between the real samples. This form of interpolation lends itself to curved and irregular signal shapes, which are far more common in the real world than pure square waves and pulses. Because of this, sin x/x interpolation is the preferred method for applications where the sample rate is three to five times the system bandwidth.
If the sample rate isn’t fast enough, high-frequency components can “fold down” into a lower frequency, causing aliasing in the display, as demonstrated in Figure 28. In addition, real-time sampling is further complicated by the high-speed memory required to store the waveform once it is digitized.
Please refer to the Sample Rate and Record Length sections in Chapter 3—Evaluating Oscilloscopes for additional detail about the sample rate and record length needed to accurately characterize high-frequency components.

Figure 29: Linear and sin x/x interpolation.
Equivalent-time Sampling Method
When measuring high-frequency signals, the oscilloscope may not be able to collect enough samples in one sweep. Equivalent-time sampling can be used to accurately acquire signals whose frequency exceeds half the oscilloscope’s sample rate (Figure 30).

Figure 30: Some oscilloscopes use equivalent-time sampling to capture and display very fast, repetitive signals.
Equivalent-time digitizers (samplers) take advantage of the fact that most naturally occurring and man-made events are repetitive. Equivalent-time sampling constructs a picture of a repetitive signal by capturing a little bit of information from each repetition.
The waveform slowly builds up like a string of lights, illuminating one-by-one. This allows the oscilloscope to accurately capture signals whose frequency components are much higher than the oscilloscope’s sample rate. There are two types of equivalent-time sampling methods: random and sequential. Each has its advantages:
- Random equivalent-time sampling allows display of the input signal prior to the trigger point, without the use of a delay line.
- Sequential equivalent-time sampling provides much greater time resolution and accuracy.
Both require that the input signal be repetitive.
Random Equivalent-time Sampling
Random equivalent-time digitizers (samplers) use an internal clock that runs asynchronously with respect to the input signal and the signal trigger (Figure 31).

Figure 31: In random equivalent-time sampling, the sampling clock runs asynchronously with the input signal and the trigger.
Samples are taken continuously, independent of the trigger position, and are displayed based on the time difference between the sample and the trigger. Although samples are taken sequentially in time, they are random with respect to the trigger, hence the name “random” equivalent-time sampling. Sample points appear randomly along the waveform when displayed on the oscilloscope screen.
The ability to acquire and display samples prior to the trigger point is the key advantage of this sampling technique, eliminating the need for external pre-trigger signals or delay lines.
Depending on the sample rate and the time window of the display, random sampling may also allow more than one sample to be acquired per triggered event. However, at faster sweep speeds, the acquisition window narrows until the digitizer cannot sample on every trigger.
It is at these faster sweep speeds that very precise timing measurements are often made, and where the extraordinary time resolution of the sequential equivalent-time sampler is most beneficial. The bandwidth limit for random equivalent-time sampling is less than that for sequential-time sampling.
Sequential Equivalent-time Sampling
The sequential equivalent-time sampler acquires one sample per trigger, independent of the time/div setting, or sweep speed, as shown in Figure 32.

Figure 32: In sequential equivalent-time sampling, the single sample is taken for each recognized trigger after a time delay which is incremented after each cycle.
When a trigger is detected, a sample is taken after a very short, but well-defined, delay. When the next trigger occurs, a small time increment—delta t—is added to this delay and the digitizer takes another sample.
This process is repeated many times, with “delta t” added to each previous acquisition, until the time window is filled. Sample points appear from left to right in sequence along the waveform when displayed on the oscilloscope screen.
Technologically speaking, it is easier to generate a very short, very precise “delta t” than it is to accurately measure the vertical and horizontal positions of a sample relative to the trigger point, as required by random samplers. This precisely measured delay is what gives sequential samplers their unmatched time resolution.
With sequential sampling, the sample is taken after the trigger level is detected, so the trigger point cannot be displayed without an analog delay line. This may, in turn, reduce the bandwidth of the instrument. If an external pretrigger can be supplied, bandwidth will not be affected.
Position and Seconds per Division
The horizontal position control moves the waveform left and right to exactly where you want it on the screen. The seconds-per-division setting (usually written as sec/div) lets you select the rate at which the waveform is drawn across the screen (also known as the time base setting or sweep speed).
This setting is a scale factor. If the setting is 1 ms, each horizontal division represents 1 ms and the total screen width represents 10 ms, or ten divisions. Changing the sec/div setting enables you to look at longer and shorter time intervals of the input signal.
As with the vertical volts/div scale, the horizontal sec/div scale may have variable timing, allowing you to set the horizontal time scale between the discrete settings.
Time Base Selections
Your oscilloscope has a time base, which is usually referred to as the main time base. Many oscilloscopes also have what is called a delayed time base. This is a time base with a sweep that can start (or be triggered to start) relative to a pre-determined time on the main time base sweep.
Using a delayed time base sweep allows you to see events more clearly and to see events that are not visible solely with the main time base sweep.
The delayed time base requires the setting of a time delay and the possible use of delayed trigger modes and other settings not described in this primer. Refer to the manual supplied with your oscilloscope for information on how to use these features.
Zoom/Pan
Your oscilloscope may have special horizontal magnification settings that let you display a magnified section of the waveform on-screen. Some oscilloscopes add pan functions to the zoom capability. Knobs are used to adjust zoom factor or scale and the pan of the zoom box across the waveform.
Search
Some oscilloscopes offer search and mark capabilities, enabling you to quickly navigate through long acquisitions looking for user-defined events.
XY Mode
Most oscilloscopes have an XY mode that lets you display an input signal, rather than the time base, on the horizontal axis. This mode of operation opens up a whole new area of phase shift measurement techniques, as explained in the Oscilloscope Measurement Techniques section of Chapter 5—Setting Up and Using an Oscilloscope.
Z Axis
A digital phosphor oscilloscope (DPO) has a high display sample density and an innate ability to capture intensity information. With its intensity axis (Z-axis), the DPO is able to provide a three-dimensional, real-time display similar to that of an analog oscilloscope.
As you look at the waveform trace on a DPO, you can see brightened areas. These are the areas where a signal occurs most often.
This display makes it easy to distinguish the basic signal shape from a transient that occurs only once in a while—the basic signal appears much brighter. One application of the Z-axis is to feed special timed signals into the separate Z input to create highlighted “marker” dots at known intervals in the waveform.
XYZ Mode with DPO and XYZ Record Display
Some DPOs can use the Z input to create an XY display with intensity grading. In this case, the DPO samples the instantaneous data value at the Z input and uses that value to qualify a specific part of the waveform.
Once you have qualified samples, these samples can accumulate, resulting in an intensity-graded XYZ display.
XYZ mode is especially useful for displaying the polar patterns commonly used in testing wireless communication devices, such as a constellation diagram.
Another method of displaying XYZ data is XYZ record display. In this mode the data from the acquisition memory is used rather than the DPO database.
Trigger System and Controls
An oscilloscope’s trigger function synchronizes the horizontal sweep at the correct point of the signal. This is essential for clear signal characterization. Trigger controls allow you to stabilize repetitive waveforms and capture single-shot waveforms.
The trigger makes repetitive waveforms appear static on the oscilloscope display by repeatedly displaying the same portion of the input signal. Imagine the jumble on the screen that would result if each sweep started at a different place on the signal, as illustrated in Figure 33.

Figure 33: Untriggered display.
Edge triggering, available in analog and digital oscilloscopes, is the basic and most common type. In addition to threshold triggering offered by both analog and digital oscilloscopes, many digital oscilloscopes offer numerous specialized trigger settings not offered by analog instruments.
These triggers respond to specific conditions in the incoming signal, making it easy to detect, for example, a pulse that is narrower than it should be. Such a condition is impossible to detect with a voltage threshold trigger alone.
Advanced trigger controls enable you to isolate specific events of interest to optimize the oscilloscope’s sample rate and record length. Advanced triggering capabilities in some oscilloscopes give you highly selective control.
You can trigger on pulses defined by amplitude (such as runt pulses), qualified by time (pulse width, glitch, slew rate, setup-and-hold, and time-out), and delineated by logic state or pattern (logic triggering).
Other advanced trigger functions include:
Pattern Lock Triggering: Pattern lock triggering adds a new dimension to NRZ serial pattern triggering by enabling the oscilloscope to take synchronized acquisitions of a long serial test pattern with outstanding time base accuracy.
Pattern lock triggering can be used to remove random jitter from long serial data patterns. Effects of specific bit transitions can be investigated, and averaging can be used with mask testing.
Serial Pattern Triggering: Serial pattern triggering can be used to debug serial architectures. It provides a trigger on the serial pattern of an NRZ serial data stream with built-in clock recovery and correlates events across the physical and link layer.
The instrument can recover the clock signal, identify transitions, and allow you to set the desired encoded words for the serial pattern trigger to capture.
A & B Triggering: Some trigger systems offer multiple trigger types only on a single event (A event), with delayed trigger (B event) selection limited to edge type triggering and often do not provide a way to reset the trigger sequence if the B event doesn’t occur.
Modern oscilloscopes can provide the full suite of advanced trigger types on both A and B triggers, logic qualification to control when to look for these events, and reset triggering to begin the trigger sequence again after a specified time, state, or transition so that even events in the most complex signals can be captured.
Search & Mark Triggering: Hardware triggers watch for one event type at a time, but Search can scan for multiple event types simultaneously. For example, scan for setup or hold time violations on multiple channels. Individual marks can be placed by Search indicating events that meet search criteria.
Trigger Correction: Since the trigger and data acquisition systems share different paths there is some inherent time delay between the trigger position and the data acquired. This results in skew and trigger jitter.
With a trigger correction system the instrument adjusts the trigger position and compensates for the difference of delay there is between the trigger path and the data acquisition path. This eliminates virtually any trigger jitter at the trigger point. In this mode, the trigger point can be used as a measurement reference. Serial Triggering on Specific Standard Signals I2C, CAN, LIN, etc.):
Some oscilloscopes (compare Tektronix oscilloscopes) provide the ability to trigger on specific signal types for standard serial data signals such as CAN, LIN, I2C, SPI, and others. The decoding of these signal types is also available on many oscilloscopes.
Parallel Bus Triggering: Multiple parallel buses can be defined and displayed at one time to easily view decoded parallel bus data over time. By specifying which channels are the clock and data lines, you can create a parallel bus display on some oscilloscopes that automatically decodes bus content.
You can save countless hours by using parallel bus triggers to simplify capture and analysis. Optional trigger controls in some oscilloscopes are designed specifically to examine communications signals as well.
Figure 34 highlights a few of these common trigger types in more detail. To maximize your productivity, some oscilloscopes provide an intuitive user interface to allow rapid setup of trigger parameters with wide flexibility in the test setup.
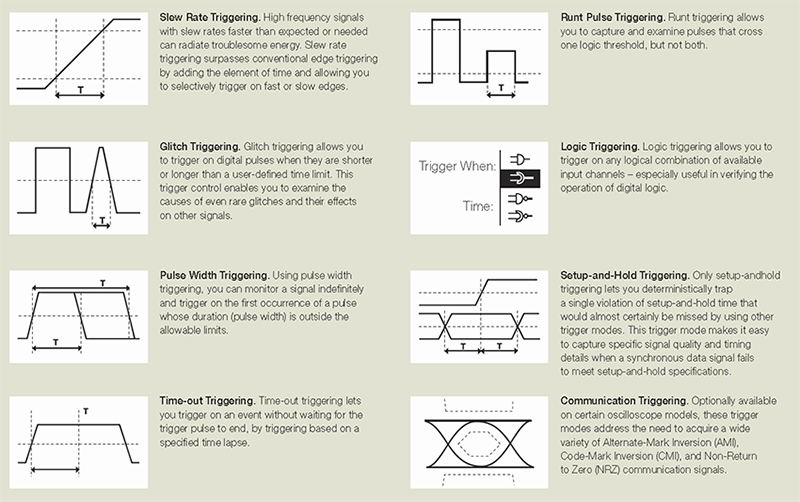
Figure 34: Common trigger types.
Trigger Position
Horizontal trigger position control is only available on digital oscilloscopes. The trigger position control may be located in the horizontal control section of your oscilloscope. It actually represents the horizontal position of the trigger in the waveform record.
Varying the horizontal trigger position allows you to capture what a signal did before a trigger event, known as pre-trigger viewing. Thus, it determines the length of viewable signal both preceding and following a trigger point.
Digital oscilloscopes can provide pre-trigger viewing because they constantly process the input signal, whether or not a trigger has been received. A steady stream of data flows through the oscilloscope; the trigger merely tells the oscilloscope to save the present data in memory.
In contrast, analog oscilloscopes only display the signal—that is, write it on the CRT—after receiving the trigger. Thus, pre-trigger viewing is not available in analog oscilloscopes, with the exception of a small amount of pre-trigger provided by a delay line in the vertical system.
Pre-trigger viewing is a valuable troubleshooting aid. If a problem occurs intermittently, you can trigger on the problem, record the events that led up to it and, possibly, find the cause.
Trigger Level and Slope
The trigger level and slope controls provide the basic trigger point definition and determine how a waveform is displayed (Figure 35).

Figure 35: Positive and negative slope triggering.
The trigger circuit acts as a comparator. You select the slope and voltage level on one input of the comparator. When the trigger signal on the other comparator input matches your settings, the oscilloscope generates a trigger.
The slope control determines whether the trigger point is on the rising or the falling edge of a signal. A rising edge is a positive slope and a falling edge is a negative slope. The level control determines where on the edge the trigger point occurs.
Trigger Sources
The oscilloscope does not necessarily need to trigger on the signal being displayed. Several sources can trigger the sweep:
- Any input channel
- An external source other than the signal applied to an input channel
- The power source signal
- A signal internally defined by the oscilloscope, from one or more input channels
Most of the time, you can leave the oscilloscope set to trigger on the channel displayed. Some oscilloscopes provide a trigger output that delivers the trigger signal to another instrument.
The oscilloscope can use an alternate trigger source, whether or not it is displayed, so you should be careful not to unwittingly trigger on channel 1 while displaying channel 2, for example.
Trigger Modes
The trigger mode determines whether or not the oscilloscope draws a waveform based on a signal condition. Common trigger modes include normal and auto:
- In normal mode the oscilloscope only sweeps if the input signal reaches the set trigger point. Otherwise, the screen is blank (on an analog oscilloscope) or frozen (on a digital oscilloscope) on the last acquired waveform. Normal mode can be disorienting since you may not see the signal at first if the level control is not adjusted correctly.
- Auto mode causes the oscilloscope to sweep, even without a trigger. If no signal is present, a timer in the oscilloscope triggers the sweep. This ensures that the display will not disappear if the signal does not cause a trigger.
In practice, you will probably use both modes: normal mode because it lets you see just the signal of interest, even when triggers occur at a slow rate, and auto mode because it requires less adjustment. Many oscilloscopes also include special modes for single sweeps, triggering on video signals, or automatically setting the trigger level.
Trigger Coupling
Just as you can select either AC or DC coupling for the vertical system, you can choose the kind of coupling for the trigger signal.
Besides AC and DC coupling, your oscilloscope may also have high frequency rejection, low frequency rejection, and noise rejection trigger coupling. These special settings are useful for eliminating noise from the trigger signal to prevent false triggering.
Trigger Holdoff
Sometimes getting an oscilloscope to trigger on the correct part of a signal requires great skill. Many oscilloscopes have special features to make this task easier.
Trigger holdoff is an adjustable period of time after a valid trigger during which the oscilloscope cannot trigger. This feature is useful when you are triggering on complex waveform shapes, so that the oscilloscope only triggers on an eligible trigger point.
Figure 36 shows how using trigger holdoff helps create a usable display.

Figure 36: Positive and negative slope triggering.
Controls for Math and Measurement Operations
Your oscilloscope may also have operations that allow you to add waveforms together, creating a new waveform display. Analog oscilloscopes combine the signals while digital oscilloscopes create new waveforms mathematically. Subtracting waveforms is another math operation.
Subtraction with analog oscilloscopes is possible by using the channel invert function on one signal and then using the add operation. Digital oscilloscopes typically have a subtraction operation available. Figure 38 illustrates a third waveform created by combining two different signals.

Figure 38: Adding channels.
Using the power of their internal processors, digital oscilloscopes offer many advanced math operations: multiplication, division, integration, Fast Fourier Transform, and more.
This advanced signal processing capability can also perform functions such as the insertion of a filter block that can be used to de-embed the characteristics of the fixture on the device under test or implement a filter block with desired frequency response such as a low pass filter.
The processing block is flexible, not dedicated. It can perform as an arbitrary filter instead. For example, for simulation of pre-emphasis/de-emphasis schemes.
Digital Timing and State Acquisitions
Digital channels provided by a mixed signal oscilloscope enable acquisition capabilities similar to those found on logic analyzers. There are two major digital acquisition techniques:
- With timing acquisition, the MSO samples the digital signal at uniformly spaced times determined by the MSO's sample rate. At each sample point, the MSO stores the signal's logic state and creates a timing diagram of the signal.
- State acquisition defines special times that the digital signal's logic state is valid and stable. This is common in synchronous and clocked digital circuits. A clock signal defines the time when the signal state is valid. For example, the input signal stable time is around the rising clock edge for a D-Flip-Flop with rising edge clocking. The output signal stable time is around the falling clock edge for a D-Flip-Flop with rising edge clocking. Since the clock period of a synchronous circuit may not be fixed, the time between state acquisitions may not be uniform as it is in a timing acquisition.
A mixed signal oscilloscope's digital channels acquire signals similar to how a logic analyzer acquires signals in timing acquisition mode.
The MSO then decodes the timing acquisition into a clocked bus display and event table display, which is similar to the logic analyzer's state acquisition. This provides important information during debugging.
Other Controls
This chapter described the basic oscilloscope controls that a beginner needs to know about. Your oscilloscope may have other controls for various functions. Some of these may include:
- Automatic parametric measurements
- Measurement cursors
- Keypads for mathematical operations or data entry
- Printing capabilities
- Interfaces for connecting your oscilloscope to a computer or directly to the Internet
Look over the other options available to you and read your oscilloscope’s manual to find out more about these other controls.
Setting Up and Using an Oscilloscope How-To Guide
Once you have an oscilloscope, there are basic things you need to do to set it up and begin using it. This chapter briefly describes these things. In particular, proper grounding is very important for safety reasons; not just for yourself but also for the integrated circuits (ICs) you are testing. Setting oscilloscope controls, calibrating the oscilloscope, connecting probes, and compensating the probes are also described, along with basic oscilloscope measurement techniques.
Proper Grounding
Proper grounding is an important step when you set up to take measurements or work on a circuit:
- Properly grounding the oscilloscope protects you from a hazardous shock.
- Properly grounding yourself protects your ICs from damage.
To ground the oscilloscope means to connect it to an electrically neutral reference point, such as earth ground. Ground your oscilloscope by plugging its three-pronged power cord into an outlet grounded to earth ground. Grounding the oscilloscope is necessary for safety. If a high voltage contacts the case of an ungrounded oscilloscope—any part of the case, including knobs that appear insulated—it can give you a shock. However, with a properly grounded oscilloscope, the current travels through the grounding path to earth ground rather than through you to earth ground.
Grounding is also necessary for taking accurate measurements with your oscilloscope. The oscilloscope needs to share the same ground as any circuits you are testing. Some oscilloscopes do not require separate connection to earth ground. These oscilloscopes have insulated cases and controls, which keeps any possible shock hazard away from the user.
If you are working with ICs, you also need to ground yourself. ICs have tiny conduction paths that can be damaged by static electricity that builds up on your body. You can ruin an expensive IC simply by walking across a carpet or taking off a sweater and then touching the leads of the IC. To solve this problem, wear a grounding strap, as shown in Figure 64. This strap safely sends static charges on your body to earth ground.

Figure 64: Typical wrist-type grounding strap.
Setting the Controls
After plugging in the oscilloscope, take a look at the front panel. As described at the beginning of Chapter 4—Oscilloscope Systems and Controls, the front panel is typically divided into three main sections labeled vertical, horizontal, and trigger. Your oscilloscope may have other sections, depending on the model and type. Notice the input connectors on your oscilloscope—this is where you attach the probes. Most oscilloscopes have at least two input channels and each channel can display a waveform on the screen. Multiple channels are useful for comparing waveforms. The front panel of a Mixed Signal Oscilloscope (MSO) willalso have digital inputs.
Some oscilloscopes have AUTOSET and/or DEFAULT buttons that can set up the controls in one step to accommodate a signal. If your oscilloscope does not have this capability, it is helpful to set the controls to standard positions before taking measurements.
Oscilloscope Instructions
- Set the oscilloscope to display channel 1.
- Set the vertical volts/division scale and position controls to mid–range positions.
- Turn off the variable volts/division.
- Turn off all magnification settings.
- Set the channel 1 input coupling to DC.
- Set the trigger mode to auto.
- Set the trigger source to channel 1.
- Turn trigger holdoff to minimum or off.
- Set the horizontal time/division and position controls to mid-range positions.
- Adjust channel 1 volts/division such that the signal occupies as much of the 10 vertical divisions as possible without clipping or signal distortion.
Calibrating the Instrument
In addition to proper oscilloscope setup, periodic instrument self-calibration is recommended for accurate measurements. Oscilloscope calibration is needed if the ambient temperature has changed more than 5° C (9° F) since the last self-calibration or once per week. In the oscilloscope menu, this can sometimes be initiated as Signal Path Compensation. Refer to the manual that accompanied your oscilloscope for more detailed instructions.
Connecting the Probes
Once you have properly grounded the oscilloscope and yourself, and you’ve set up the oscilloscope in standard positions, you are ready to connect a probe to your oscilloscope. A probe, if well-matched to the oscilloscope, enables you to access all of the power and performance in the oscilloscope and will ensure the integrity of the signal you are measuring. Measuring a signal requires two connections:
- The probe tip connection
- The ground connection
Probes often come with a clip attachment for grounding the probe to the circuit under test. In practice, you attach the grounding clip to a known ground in the circuit, such as the metal chassis of a product you are repairing, and touch the probe tip to a test point in the circuit.
Compensating the Probes
Passive attenuation voltage probes must be compensated to the oscilloscope. Before using a passive probe, you need to compensate it to balance its electrical properties to a particular oscilloscope. You should get into the habit of compensating the probe every time you set up your oscilloscope. A poorly adjusted probe can make your measurements less accurate. Figure 65 illustrates the effects on a 1 MHz test signal when using a probe that is not properly compensated.
Most oscilloscopes have a square wave reference signal available at a terminal on the front panel used to compensate the probe. General instructions to compensate the probe are as follows:
- Attach the probe to a vertical channel.
- Connect the probe tip to the probe compensation, i.e. square wave reference signal.
- Attach the ground clip of the probe to ground.
- View the square wave reference signal.
- Make the proper adjustments on the probe so that the corners of the square wave are square.
Oscilloscope Measurement Techniques
The two most basic measurements you can make are:
- Voltage measurements
- Time measurements
Just about every other measurement is based on one of these two fundamental techniques.
This section discusses methods for taking measurements visually with the oscilloscope screen. This is a common technique with analog instruments, and also may be useful for “at-a-glance” interpretation of digital oscilloscope displays.
Note that most digital oscilloscopes include automated measurement tools that simplify and accelerate common analysis tasks, thus improving the reliability and confidence of your measurements. However, knowing how to make measurements manually as described here will help you understand and check the automatic measurements.
Voltage Measurements
Voltage is the amount of electric potential, expressed in volts, between two points in a circuit. Usually one of these points is ground (zero volts), but not always. Voltages can also be measured from peak-to-peak. That is, from the maximum point of a signal to its minimum point. You must be careful to specify which voltage you mean. The oscilloscope is primarily a voltage-measuring device. Once you have measured the voltage, other quantities are just a calculation away. For example, Ohm’s law states that voltage between two points in a circuit equals the current times the resistance. From any two of these quantities you can calculate the third using the formula shown below.

Voltage = Current x Resistance
Another handy formula is the power law, which states that the power of a DC signal equals the voltage times the current. Calculations are more complicated for AC signals, but the point here is that measuring the voltage is the first step toward calculating other quantities. Figure 66 shows the voltage of one peak (Vp) and the peak-to-peak voltage (Vp–p).

Figure 66: Voltage peak (Vp) and peak-to-peak voltage (Vp-p).
The most basic method of taking voltage measurements is to count the number of divisions a waveform spans on the oscilloscope’s vertical scale. Adjusting the signal to cover most of the display vertically makes for the best voltage measurements, as shown in Figure 67. The more display area you use, the more accurately you can read the measurement.

Figure 67: Measure voltage on the center vertical graticule line.
Many oscilloscopes have cursors that let you make waveform measurements automatically, without having to count graticule marks. A cursor is simply a line that you can move across the display. Two horizontal cursor lines can be moved up and down to bracket a waveform’s amplitude for voltage measurements, and two vertical lines move right and left for time measurements. A readout shows the voltage or time at their positions.
Time and Frequency Measurements
You can make time measurements using the horizontal scale of the oscilloscope. Time measurements include measuring the period and pulse width of pulses. Frequency is the reciprocal of the period, so once you know the period, the frequency is one divided by the period. Like voltage measurements, time measurements are more accurate when you adjust the portion of the signal to be measured to cover a large area of the display, as illustrated in Figure 68.

Figure 68: Measure time on the center horizontal graticule line.
Pulse Width and Rise Time Measurements
In many applications, the details of a pulse’s shape are important. Pulses can become distorted and cause a digital circuit to malfunction, and the timing of pulses in a pulse train is often significant.
Standard pulse measurements are pulse rise time and pulse width. Rise time is the amount of time a pulse takes to go from a low to high voltage. By convention, the rise time is measured from 10% to 90% of the full voltage of the pulse. This eliminates any irregularities at the pulse’s transition corners.
Pulse width is the amount of time the pulse takes to go from low to high and back to low again. By convention, the pulse width is measured at 50% of full voltage. Figure 69 illustrates these measurement points.

Figure 69: Rise time and pulse width measurement points.
Pulse measurements often require fine-tuning the triggering. To become an expert at capturing pulses, you should learn how to use trigger hold-off and how to set the digital oscilloscope to capture pre-trigger data, as described in Chapter 4—Oscilloscope Systems and Controls.. Horizontal magnification is another useful feature for measuring pulses, since it allows you to see fine details of a fast pulse.
This is content
This is content 2
This is content 3
This is content 4
This is content
This is additional content
This is content 2
This is additional content
Overview Content
Camera operators face the first challenge of the 4K transition, as HDR production requires more attention during acquisition than SDR production. Whether you’re filming live UHD content like a football game, or episodic UHD content like a TV series, you’ll find familiar measurement tools and advanced analytics with Tektronix. Tektronix’s patented Stop Display allows you to instantly check the dynamic range of shooting, regardless of camera type—whether SDR, HDR, or both—simplifying the process of monitoring a wide variety of different camera gammas and HDR specifications like ST2084 PQ and HLG.
eBook: Understanding the Challenges of Creating 4K Content
Poster: An Overview in Creating 4K UHD Content
More on WFM8000 Series 4K/UHD Waveform Monitors
Camera operators face the first challenge of the 4K transition, as HDR production requires more attention during acquisition than SDR production. Whether you’re filming live UHD content like a football game, or episodic UHD content like a TV series, you’ll find familiar measurement tools and advanced analytics with Tektronix. Tektronix’s patented Stop Display allows you to instantly check the dynamic range of shooting, regardless of camera type—whether SDR, HDR, or both—simplifying the process of monitoring a wide variety of different camera gammas and HDR specifications like ST2084 PQ and HLG.
eBook: Understanding the Challenges of Creating 4K Content
Models Content
Camera operators face the first challenge of the 4K transition, as HDR production requires more attention during acquisition than SDR production. Whether you’re filming live UHD content like a football game, or episodic UHD content like a TV series, you’ll find familiar measurement tools and advanced analytics with Tektronix. Tektronix’s patented Stop Display allows you to instantly check the dynamic range of shooting, regardless of camera type—whether SDR, HDR, or both—simplifying the process of monitoring a wide variety of different camera gammas and HDR specifications like ST2084 PQ and HLG.
eBook: Understanding the Challenges of Creating 4K Content
Poster: An Overview in Creating 4K UHD Content
More on WFM8000 Series 4K/UHD Waveform Monitors
Camera operators face the first challenge of the 4K transition, as HDR production requires more attention during acquisition than SDR production. Whether you’re filming live UHD content like a football game, or episodic UHD content like a TV series, you’ll find familiar measurement tools and advanced analytics with Tektronix. Tektronix’s patented Stop Display allows you to instantly check the dynamic range of shooting, regardless of camera type—whether SDR, HDR, or both—simplifying the process of monitoring a wide variety of different camera gammas and HDR specifications like ST2084 PQ and HLG.
eBook: Understanding the Challenges of Creating 4K Content
Compare Content
Camera operators face the first challenge of the 4K transition, as HDR production requires more attention during acquisition than SDR production. Whether you’re filming live UHD content like a football game, or episodic UHD content like a TV series, you’ll find familiar measurement tools and advanced analytics with Tektronix. Tektronix’s patented Stop Display allows you to instantly check the dynamic range of shooting, regardless of camera type—whether SDR, HDR, or both—simplifying the process of monitoring a wide variety of different camera gammas and HDR specifications like ST2084 PQ and HLG.
eBook: Understanding the Challenges of Creating 4K Content
Poster: An Overview in Creating 4K UHD Content
More on WFM8000 Series 4K/UHD Waveform Monitors
Camera operators face the first challenge of the 4K transition, as HDR production requires more attention during acquisition than SDR production. Whether you’re filming live UHD content like a football game, or episodic UHD content like a TV series, you’ll find familiar measurement tools and advanced analytics with Tektronix. Tektronix’s patented Stop Display allows you to instantly check the dynamic range of shooting, regardless of camera type—whether SDR, HDR, or both—simplifying the process of monitoring a wide variety of different camera gammas and HDR specifications like ST2084 PQ and HLG.
eBook: Understanding the Challenges of Creating 4K Content
Software Content
Camera operators face the first challenge of the 4K transition, as HDR production requires more attention during acquisition than SDR production. Whether you’re filming live UHD content like a football game, or episodic UHD content like a TV series, you’ll find familiar measurement tools and advanced analytics with Tektronix. Tektronix’s patented Stop Display allows you to instantly check the dynamic range of shooting, regardless of camera type—whether SDR, HDR, or both—simplifying the process of monitoring a wide variety of different camera gammas and HDR specifications like ST2084 PQ and HLG.
eBook: Understanding the Challenges of Creating 4K Content
Poster: An Overview in Creating 4K UHD Content
More on WFM8000 Series 4K/UHD Waveform Monitors
Camera operators face the first challenge of the 4K transition, as HDR production requires more attention during acquisition than SDR production. Whether you’re filming live UHD content like a football game, or episodic UHD content like a TV series, you’ll find familiar measurement tools and advanced analytics with Tektronix. Tektronix’s patented Stop Display allows you to instantly check the dynamic range of shooting, regardless of camera type—whether SDR, HDR, or both—simplifying the process of monitoring a wide variety of different camera gammas and HDR specifications like ST2084 PQ and HLG.
eBook: Understanding the Challenges of Creating 4K Content
Probes & Accessories Content
Camera operators face the first challenge of the 4K transition, as HDR production requires more attention during acquisition than SDR production. Whether you’re filming live UHD content like a football game, or episodic UHD content like a TV series, you’ll find familiar measurement tools and advanced analytics with Tektronix. Tektronix’s patented Stop Display allows you to instantly check the dynamic range of shooting, regardless of camera type—whether SDR, HDR, or both—simplifying the process of monitoring a wide variety of different camera gammas and HDR specifications like ST2084 PQ and HLG.
eBook: Understanding the Challenges of Creating 4K Content
This is content
This is content 2
This is content 3
This is content 4
Featured Content
Get End to End Measurement Accuracy

The oscilloscope that includes a logic analyzer, spectrum analyzer and protocol analyzer – all synchronized for an integrated view. Use powerful trigger, search and analysis tools to zero in on analog, digital and RF anomalies.
Get End to End Measurement Accuracy
The oscilloscope that includes a logic analyzer, spectrum analyzer and protocol analyzer – all synchronized for an integrated view. Use powerful trigger, search and analysis tools to zero in on analog, digital and RF anomalies.
Get End to End Measurement Accuracy
The oscilloscope that includes a logic analyzer, spectrum analyzer and protocol analyzer – all synchronized for an integrated view. Use powerful trigger, search and analysis tools to zero in on analog, digital and RF anomalies.
Get End to End Measurement Accuracy
The oscilloscope that includes a logic analyzer, spectrum analyzer and protocol analyzer – all synchronized for an integrated view. Use powerful trigger, search and analysis tools to zero in on analog, digital and RF anomalies.
Get End to End Measurement Accuracy
The oscilloscope that includes a logic analyzer, spectrum analyzer and protocol analyzer – all synchronized for an integrated view. Use powerful trigger, search and analysis tools to zero in on analog, digital and RF anomalies.
Featured Content
Get End to End Measurement Accuracy
The oscilloscope that includes a logic analyzer, spectrum analyzer and protocol analyzer – all synchronized for an integrated view. Use powerful trigger, search and analysis tools to zero in on analog, digital and RF anomalies.
Get End to End Measurement Accuracy
The oscilloscope that includes a logic analyzer, spectrum analyzer and protocol analyzer – all synchronized for an integrated view. Use powerful trigger, search and analysis tools to zero in on analog, digital and RF anomalies.
Get End to End Measurement Accuracy
The oscilloscope that includes a logic analyzer, spectrum analyzer and protocol analyzer – all synchronized for an integrated view. Use powerful trigger, search and analysis tools to zero in on analog, digital and RF anomalies.
Learn how the path of digital measurement technology is leading to new insights.
Learn how the path of digital measurement technology is leading to new insights.
Learn how the path of digital measurement technology is leading to new insights.

3 Series MDO
Mixed-Domain Oscilloscope
The award-winning 3 Series MDO gets even better with industry-first features and big savings.
- 11.6" HD (1920x1080) touchscreen
- 5 Gs/s maximum sampling rate, and 10M record length
- Built-in spectrum analyzer in 1 GHz or 3 GHz versions
Limited-Time Offer
Get 75% off 3-BND application bundle and free digital channels (3-BND application bundle includes all serial options and power analysis)
4 Series MSO
Mixed-Signal Oscilloscope
Flexibility. Upgradeability. Affordability. 4 Series MSO delivers all of the above, with big savings.
- 13.3" HD (1920x1080) touchscreen
- Up to 6 FlexChannel® inputs for analog or digital channels
- 12-bit vertical resolution
Limited-Time Offer
Buy a 350 MHz or higher model, and receive a free bandwidth upgrade license plus free 4-AFG, 4-PWR-BAS, 4-SRAUTO, 4-SRCOMP, 4-EMBD, and 4-SV-BAS
Keithley SMU 2600
Source Measure Unit
Put 75 years of accuracy on your bench with Keithley Series 2600 System Source Measure Units, now with even more reasons to upgrade.
- Ideal current-voltage source and measure solution
- Integrated precision power supply, true current source, DMM, and electronic load with pulse generating capabilities
- TSP® technology runs complete test programs for automated system applications
Limited-Time Offer
15% off entire purchase with purchase two or more SMU 2600 Series instruments
Learn how the path of digital measurement technology is leading to new insights.
Learn how the path of digital measurement technology is leading to new insights.
Learn how the path of digital measurement technology is leading to new insights.


